Page History
| Anchor | ||||
|---|---|---|---|---|
|
| Info |
|---|
This is an application for filtering seismic catalogs. The product is a new catalog filtered upon the User's parameters setting.
|
Step by Step
- The input file is a seismic catalog that can be uploaded from 'Change Input' tab (shown in the
 of Figure 1).
 - Next, the User may perform various filtering according to the values of the attributes assigned in the catalog. The User may choose one of these attributes (as ID, ML, Lat etc, displayed in Figure 1 in the
 ) and provide the values he/she wishes, selecting among 'Select all values' (e.g ID field, Figure 1), 'Select Range' (from the calendar - Field 1, Figure 1, or by typing values range - Field 2, Figure 1) and 'Select list of values' (Field 3 Figure 1).
CATEGORY Filtering Tools
KEYWORDS Data selection, Data filtering
CITATION Please acknowledge use of this application in your work:IS-EPOS. (2016). Data Handling Applications [Web applications]. Retrieved from https://tcs.ah-epos.eu/
| Widget Connector | ||||||
|---|---|---|---|---|---|---|
|

Figure 1. Input options of the application
3. Alternatively, the User may apply interactively spatial filtering by clicking in the "Select events from map" tab (depicted by the upper  in Figure 1). This option grants to the User the possibility to select data, spatially constrained
by a predefined shape (numbers 2-4 in Figure 2):
- No draw option.
- Draw a polygon.The User may select data into a polygon drawn after clicking on different points of the map. To close the polygon, the User has to double click on the last point, such that this point will be connected with the first one.
- Draw a rectangle. To select data into a rectangular the User has to click on a point of the map and move the cursor to any direction. A second left mouse button click will restrict the selected area at its current state.
- Draw a circle (option demonstrated in Figure 2). To select data into a circular the User has to click on a point of the map and move the cursor to any direction. A second left mouse button click will restrict the selected area at its current state.
Note that the first click on the map defines the circle's center.
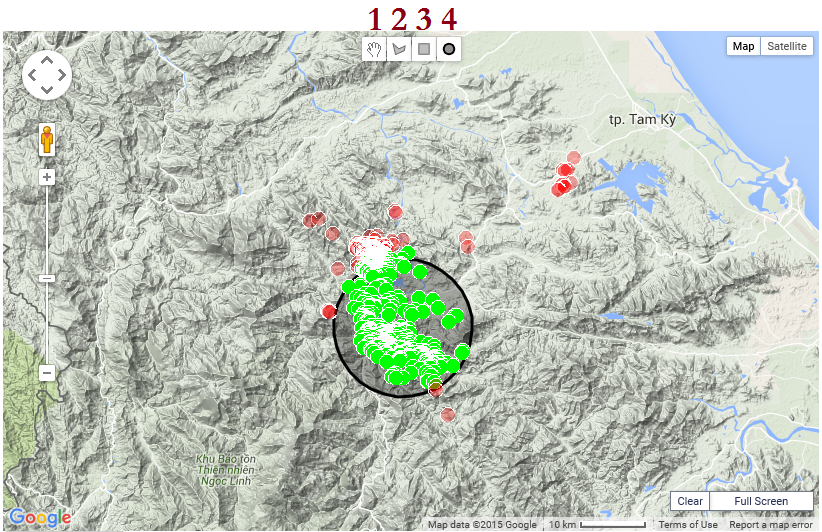
Figure 2. Interactive selection of data
4. As soon as the filtering criteria have been defined, the User shall click on the ![]() button (green button at the bottom of Figure 1) to apply the those criteria. The User may also select the
button (green button at the bottom of Figure 1) to apply the those criteria. The User may also select the  tab (indicated by the green frame, at the bottom of Figure 1) in order to view an illustration of the events from the original catalog (red circles) and the events included in the filtered catalog (green circles). A new catalog ('catalog.mat') has been created and it is available for any further processing. In addition the system provides all the information and applications that are valid for the original catalogs (see "AH Episodes" Chapter, for details).
Related Documents
| Content by Label | ||||||||||||||||
|---|---|---|---|---|---|---|---|---|---|---|---|---|---|---|---|---|
|
![]()
Overview
Content Tools