Page History
| Anchor | ||||
|---|---|---|---|---|
|
| Info |
|---|
The program is used to establish empirical scaling relationships between different magnitude scales. different linear regression procedures (i.e. the general orthogonal regression, the ordinary least squares and the inverted least squares) are available for converting magnitudes from one type into another one. The logarithm of seismic energy or seismic moment can be used as input as well. At least 2 input parameters (e.g. magnitude, moment or energy columns) should be available in the input catalog.
|
REFERENCES Document Repository
CATEGORY Collective Properties of Seismicity
KEYWORDS Data conversion
CITATION Please acknowledge use of this application in your work:
IS-EPOS. (2016). Data Handling Applications [Web applications]. Retrieved from https://tcs.ah-epos.eu/
Step by Step
- The input file is the seismic catalog that can be uploaded from 'Change Input' tab (shown on right side of Figure 1).
The application can be performed only in datasets in which more than one magnitude scale (or, alternatively, 'Energy' or 'Seismic Moment' can be introduced as inputs as well) is assigned for the seismic events (e.g. ML and Mw).
The parameters that the user has to set/choose are also shown in Figure 1:

Figure 1. Input and output of the application
2. The following parameters the User needs to specify:
- Choose first vector to compare - The user may choose among the different magnitude scales available in the catalog.
- Choose second vector to compare - The user may choose among the different magnitude scales available in the catalog.
- Regression Method - Three different regression methods can be used - General Orthogonal Regression, Standard Least Squares and Inverted Least Squares.
- Error Variance Ratio - A float number should be assigned here (default is 1). Note that this option is only valid when General Orthogonal Regression method, is chosen.
3. The outputs that the application produces are:
- A report with the parameters (slope and intercept) of the regression process and some associated statistical parameters (Figure 1)
- Vectors of the first, second magnitude selected, together with the vector of the new (converted) magnitudes obtained by the application of the regression equation.
- A figure with one magnitude scale plotted versus the other one (scatter plot) and the linear regression curve (Figure 2). Zooming option is enabled for this Figure.
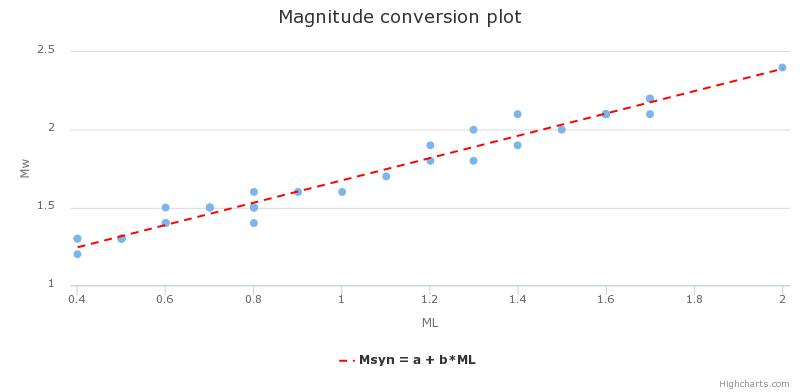
Figure 2. Output plot produced by the application

Overview
Content Tools