Page History
| Anchor | ||||
|---|---|---|---|---|
|
| Info |
|---|
This application implements TRMLOC localization/relocalization software which performs efficiently the inversion of seismic (acoustic) first arrival time onsets for hypocenter location using the probabilistic inverse theory approach. The application estimates the maximum likelihood hypocenter location, enables other hypocenter location estimators to be calculated and it allows an advanced analysis of location (inversion) uncertainties, providing in addition, meta-characteristics of the data and solutions.
|
REFERENCES Document Repository
CATEGORY Source Parameter Estimation
KEYWORDS Source parameters, Source location
CITATION Please acknowledge use of this application in your work:
IS-EPOS. (2015). Localization [Web application]. Retrieved from https://tcs.ah-epos.eu/
Step by Step
After the User adds the Application into his/her personal workspace, the window as shown in Figure 1 appears. The following files are necessary in order to perform the source location, as shown in Figure 1:
- Seed Waveform: The User selects a Seed file from the Episode database, or after applying the ‘Signal Download Tool’ (see “Data Handling Applications” chapter).
- Catalog: The User selects a Seismic Catalog from the Episode database (See "AH Episodes" chapter)
- Seismic Event: The User select a seismic event which has been downloaded after applying the ‘Signal Download Tool’ (see “Data Handling Applications” chapter).
- Seismogram picks: P-wave first arrival picks, selected by the User from the waveforms (described below)
- Velocity Model: Velocity model uploaded from the Geological data of the selected Episode (see "AH Episodes" chapter).
Now, all data needed is available for the 'TRMLOC' application.

Figure 1. Input files selection
The TRMLOC application can be selected from catalog or from the seed file as shown in Figure 1b:

Figure 1b. Selection of the application from the waveform data uploaded in the workspace
- MiniSEED Waveform
- Network inverntory
- Catalog
- Velocity Model

Figure 1. Inputs for the "Localization" application.
The User can upload files which are already available in his/her personal workspace (green filed in Figure 2) after clicking "SELECT FILES" (red filed in Figure 2). However, if User is not in possession of such files, he/she can obtain them from "Data Search" (green filed in Figure 3).

Figure 2. Input data uploading files for the application.

Figure 3. Application input information.
Once all these files are uploaded the waveforms are shown on the screen and are available for elaboration. As depicted in Figure 4Once all these files are selected, a map appears on the screen showing the epicenter of the selected event (red circle) and the locations of the seismic stations comprising the regional network (green triangles), as demonstrated in Figure 2. Information on the event and the stations appears on the screen, after clicking on the circle or the triangles, respectively. Moreover, the waveforms are also shown in the screen and are available for elaboration (see also "Waveform viewer guide" in "Visualization" chapter). As depicted in Figure 2, only the vertical channels are shown by default, since the methodology applied in this application uses only P-waves. Nevertheless, the User can make all the channels appear on the window, by ticking the "E" and "N" components, next to below the 'Show channels' field, just below the map in Figure 2.


Figure 24. Picking p-wave arrival times on the waveforms
In this application the User has to pick a single point in each waveform (Figure 24), instead of a phase (i.e. two points, starting and ending). For the waveform processing details see also "FOCI” and “Spectral Analysis” chapters.
NOTE: Although it is not necessary to pick P-wave arrivals in all of the waveforms to run the application, a minimum of 3 picks is required for the application to proceed to the calculations (stated also at the top of Figure 5). The number of the seismograms and P-wave phases picked, are updated, each time the User selects makes a new picking. The User may also load picks from XML file (red filed in Figure 4) rather than processing the waveforms manually.
Parameters selected for the source localization:
'Event Coordinates' and 'Event description' can be taken from the catalog ('LOAD VALUE FROM FILE' tab, Figure 5), however the User has here the chance to modify the given values, or retry the process with different e.g. depths.
The additional input parameters required to execute the application are shown in Figure 35. Some of those parameters take numerical arguments, printed entered by the User, others take values selected from a list. In any case default values are provided. Advanced options are also available, however the application runs properly even if they are discarded. For detailed description of all application parameters please see at the TRMLOC manual at the document repository.
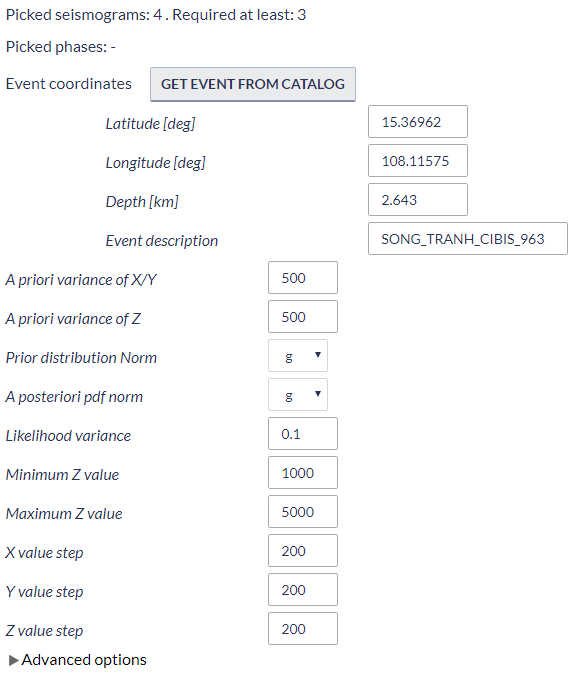
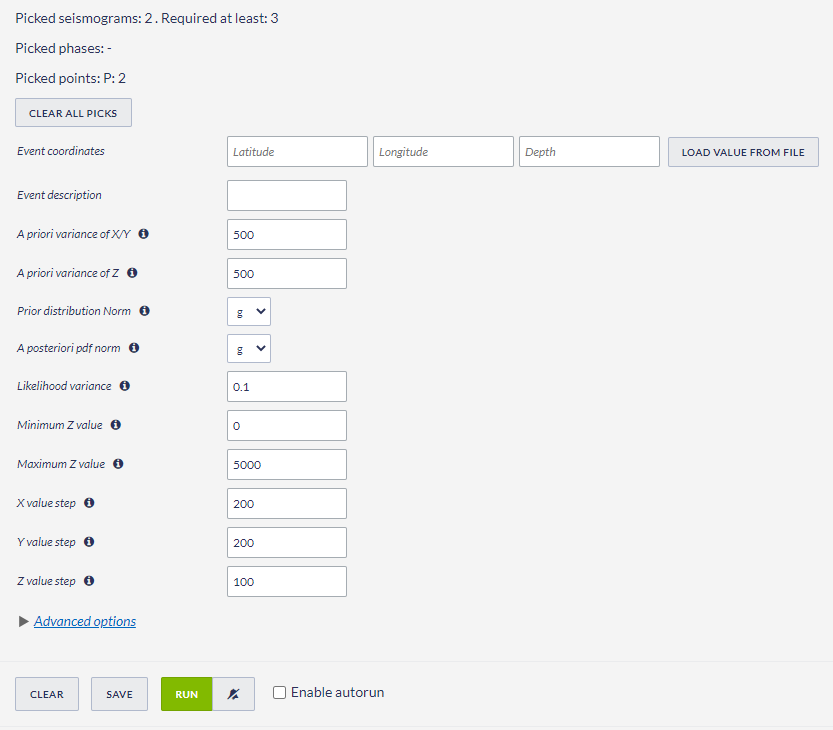
Figure 35. Input parameters for the application
Once the point picking in the waveforms and the parameter selection is over, the User shall click on 'RUN' (green button) to initiate the Source Localization process.
The results obtained after the process terminates include a variety of output values, files and figures. Numerical outputs are the hypocenter coordinates obtained by different methods, their uncertainties and the original coordinates from the catalog, for comparison (Figure 46, top). These values are also plotted in charts, one showing the epicentral location (longitude-latitude) of the original and obtained solutions together with the stations positions (Figure 46, bottom), and one more showing the vertical (depth) distribution of the aforementioned solutions. Four ascii ASCII files are also created ('logres.txt', 'resout.txt', 'xcplog.txt', and 'outxcp.txt'), which contained detailed and specialized information on the process, the results and their uncertainties. These files can be either displayed in the screen or downloaded by the User. . Two JSON files ('trmloc_result.json' and 'app_form_snapshot.json') are created as well.
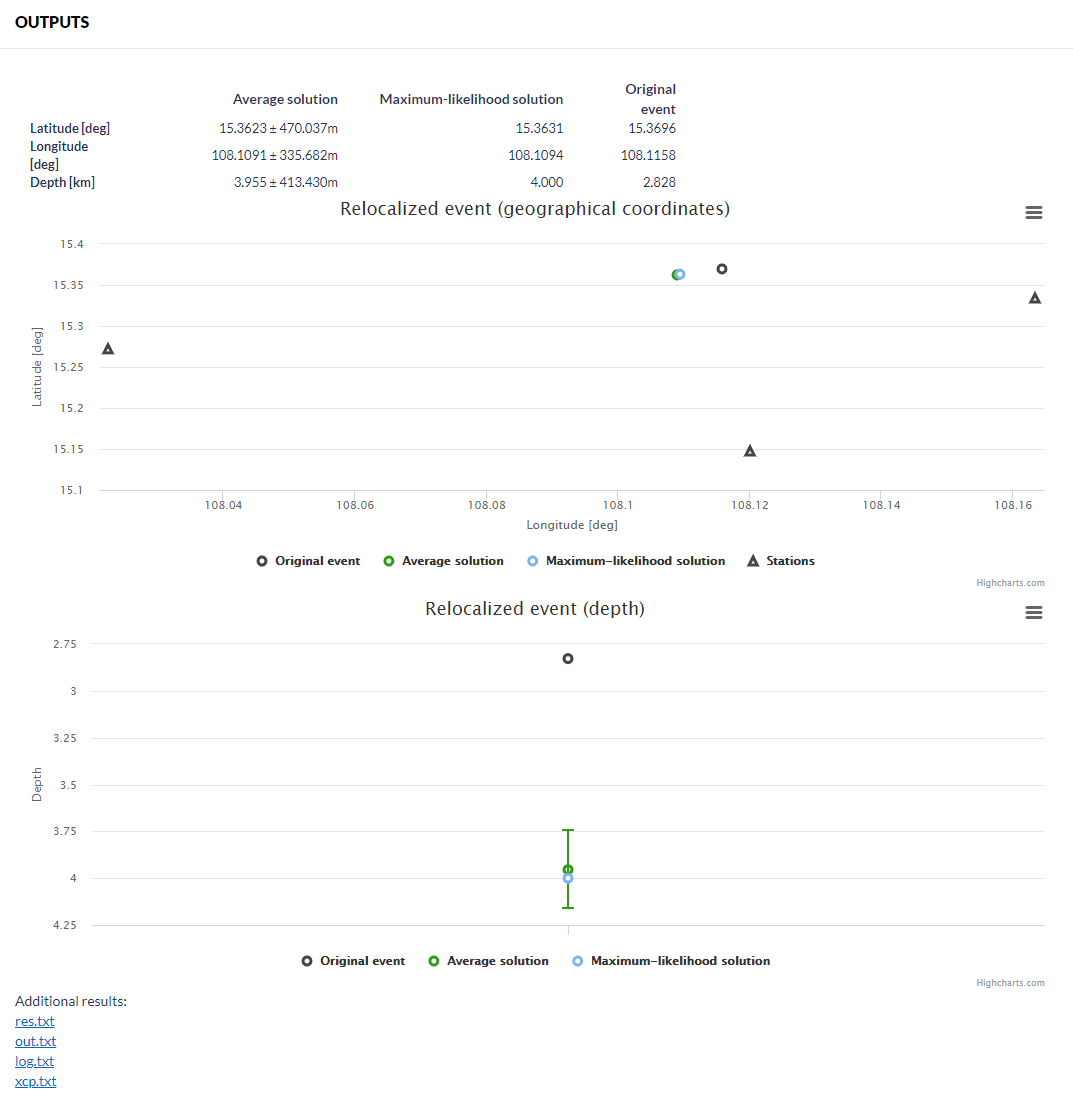
Figure 6. Outputs of the applicationFigure 4. Some of the applications outputs

Overview
Content Tools