Page History
| Anchor | ||||
|---|---|---|---|---|
|
| Info |
|---|
Application allowing for visualization of the activity changes in time relatively to the front location https://tcs.ah-epos.eu/#apps:FrontAdvanceVis . |
REFERENCESREFERENCES User Guide
CATEGORY Visualizations
KEYWORDS Episode-oriented graphics, Production data visualization, Production - seismicity interaction
CITATION Please acknowledge use of this application in your work:
IS-EPOS. (2015). Seismic Activity with Front Advance [Web application]. Retrieved from https://tcs.ah-epos.eu/
Step by step
Some visualizations connected with the Applications are described in this section. There are some special visualizations for mining-induced seismicity. They can be accessed from the 'Mining Front Advance' file (Figure 1), uploaded to the workspace from the AH-Episode database.The User may click on 'Actions' tab, then on 'USE IN VISUALIZATION' tab, and then select among the two visualizations shown in the right red panel of Figure 1 (for additional visualization - 'Integrated episode data visualization', see "AH-EPISODES Chapter").
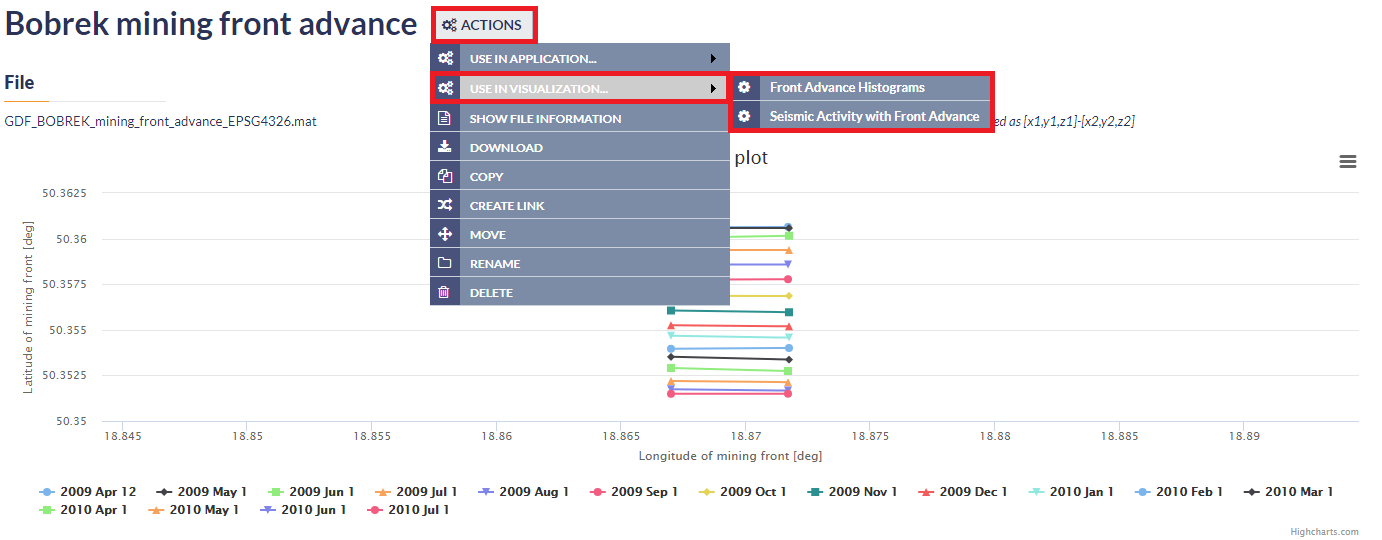
Figure 1. Selection of visualization option for the selected data
1. Input files are 'Mining Front Advance' and the corresponding seismic catalog, imported from the AH-Episode database.
2. Chose line date: The User selects the date that
The data needed for this application comes from the "AH Episodes" and in particular 'Bobrek Mine mining front advance' and 'Bobrek Mine seismic catalog', as depicted in Figure 1. Any other, previously filtered, catalog can be introduced as well.
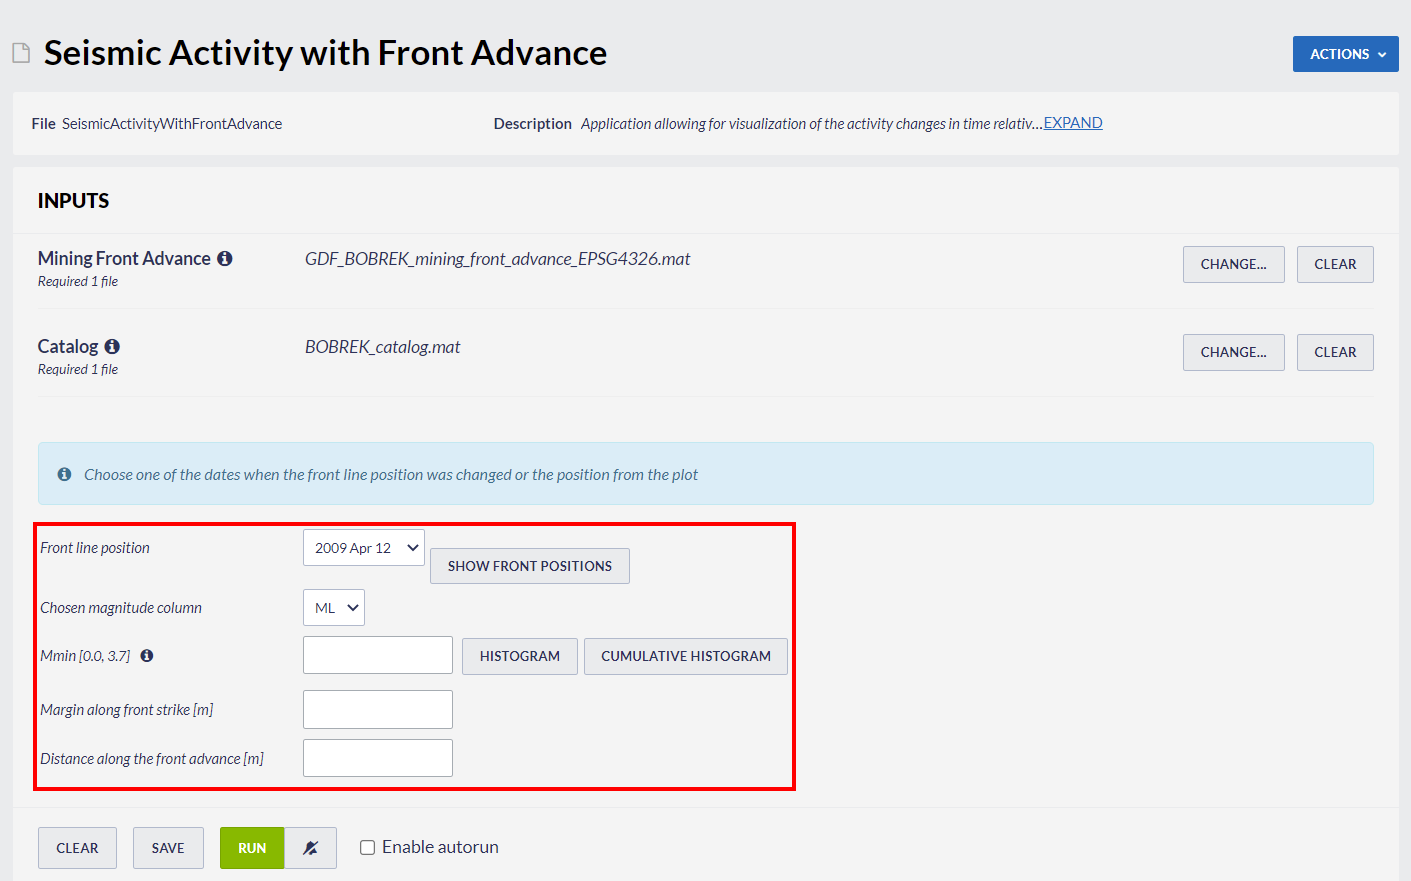
Figure 1. Input of the visualization.
After uploading "mining front advance" and "catalog" files, the User is requested to fill the fields shown in red field in Figure 1:
- Front line position - the User selects the date when the front is in a certain position, either by selecting a date from the available list, or by clicking on a certain line in the 'Front Advance Plot'
- which appears after clicking on 'SHOW FRONT POSITIONS' tab.
- Chosen magnitude column - the User may choose
3. Select Magnitude Column: The user may click on the small arrow in the respective tab in order to chose
- among different magnitude scales, in the cases where they are available (e.g. ML, Mw, etc.).
- Mmin - the User now is requested to chose the minimum magnitude (lower bound of the distribution - completeness level of the catalog). This can be done in two ways. The first is to type a single magnitude value in the empty box, possibly after he/she has performed an individual analysis (see application 'Completeness Magnitude Estimation' - CME application). The second is to graphically select the minimum magnitude from the Normal or the Cumulative histograms, which are available after clicking on the respective tabs. In both cases there is option to alter the step of the histogram's bars and to select between linear and logarithmic scale of the Y-axis for the plotting. The magnitude range is also shown in the screen.
- Margin along front strike
- - the distance (margin) along the front strike is requested in this field. This distance is equal for both directions of the front strike. Events will be spatially constrained by this margin together with the 'Distance along the front advance' (see
- item below).
- Distance along the front advance
- - The distance along the front advance is requested in this field. This distance is equal for both sides of the front (i.e. in front of and behind the front). Events will be spatially constrained by this margin together with the 'Margin along the front strike' (see
- item above).
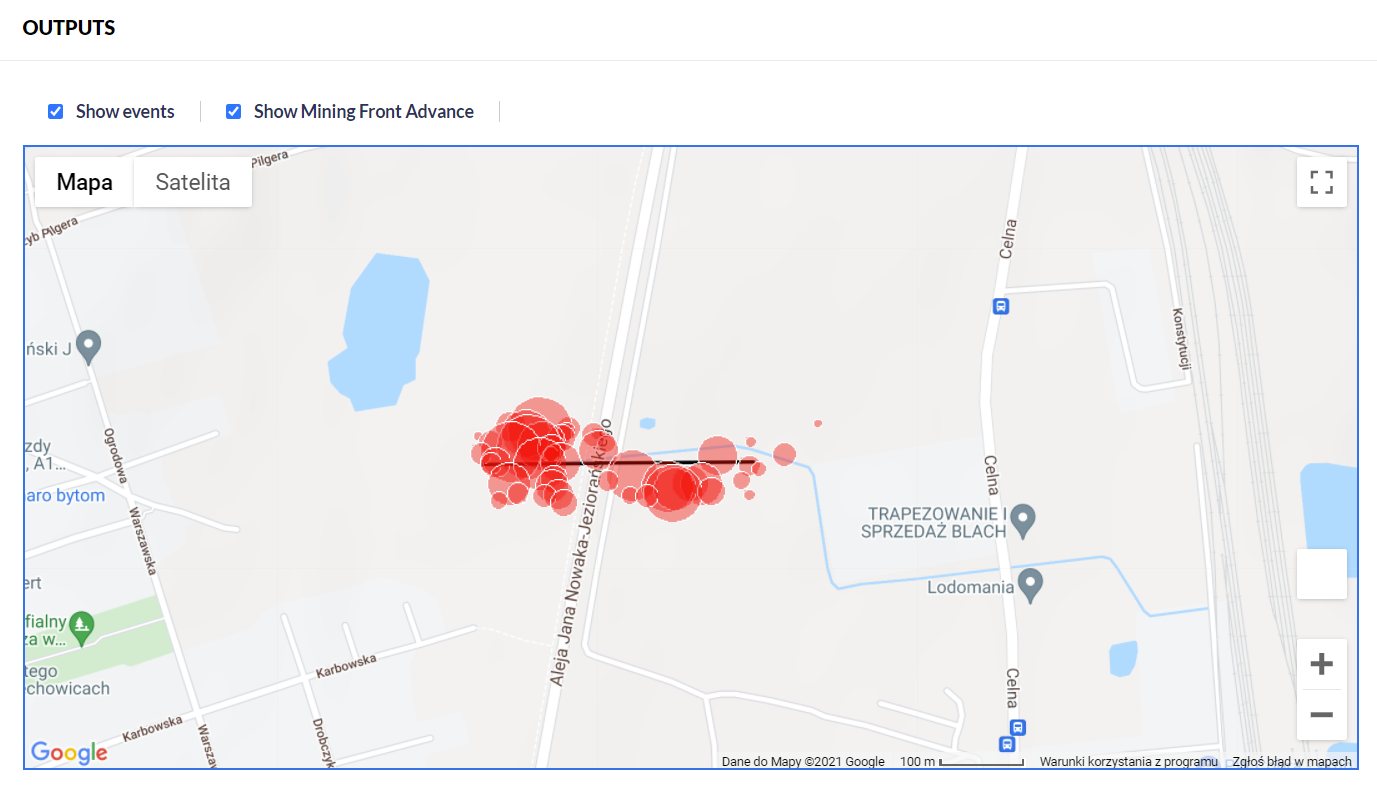
Figure 2. Output of the visualization.
Five

Figure 1b. Input parameters and files for the visualization application
The result is a map similar to the one demonstrated in Figure 1c.

Figure 1c. Output plot
Four vectors with output results, corresponding to data extracted, are also produced and they are . They are: time, the front position, the latitudes, longitudes and magnitudes of the events. These vectors are available for further processing and can be used as input for other applications. By clicking on any of them in the listoutputs, the values plots of the vector appear on the screen. In the last three of them the User can also click on 'LIST ALL VALUES' tab.

Related Documents
| Content by Label | ||||||||||||||||
|---|---|---|---|---|---|---|---|---|---|---|---|---|---|---|---|---|
|
Overview
Content Tools