Page History
| Anchor | ||||
|---|---|---|---|---|
|
| Info |
|---|
The autocorrelation (serial correlation) is a tool to find search for repeating patterns in a signal. Autocorrelation of a random process is the correlation between values of the process at different times, as a function of the two times or of the time lag . https://tcs.ah-epos.eu/#apps:Autocorrelation (i.e. correlation of a signal with itself at different time lags). |
REFERENCES Document Repository
CATEGORY Correlation Analysis
KEYWORDS
REFERENCES
Document Repository
CATEGORY
Correlation Analysis
KEYWORDS
Statistical analysis, Statistical properties of seismicity
CITATION
CITATION Please acknowledge use of this application in your work:
IS-EPOS. (2017). Autocorrelation [Web application]. Retrieved from https://tcs.ah-epos.eu/
Step by step
In order to use the Autocorrelation application the user must have upload a time series data available in the workspace. This is the mandatory input to the application. The time series data can be easily created with other tools available on the IS-EPOS platformEPISODES Platform, as described below.
The flow workflow for using Autocorrelation application:
- Choose the a catalog (or extract part of the catalog with Catalog Filter) from the episode that analysis is to be performed fora selected episode.
- Add to your user workspace the Catalog Time and Correlated parameter extractor applicationto Vector converter application. It allows to extract vectors of time and time–correlated attribute attributes of user's choice from the seismic catalog.
Select the seismic catalog you would like to use be used and choose the parameter you would like to conduct the analysis for (egto be analyze (e.g. Mw).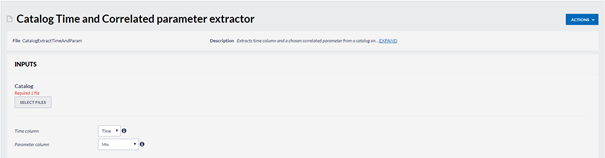
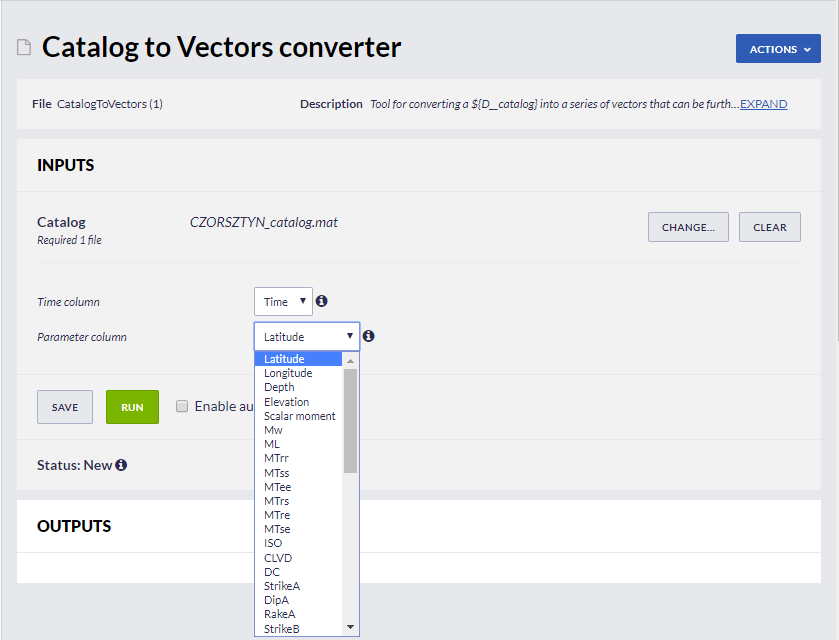
- The application generates two files: time_vector.mat and time_correlated_param_vector.mat. These are input files to the Time Series Builder application that user should to use next.
- Add the Time Series Builder to your the workspace. This application allows the user to generate data series based on time vector and time-correlated parameter vector files created in the previous step.
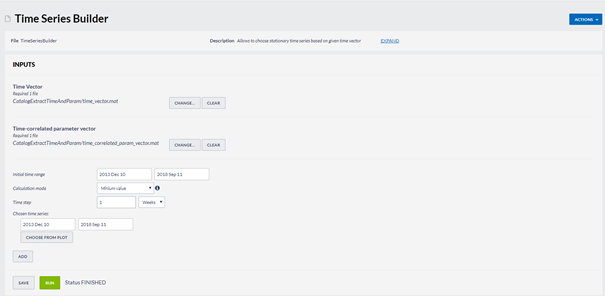
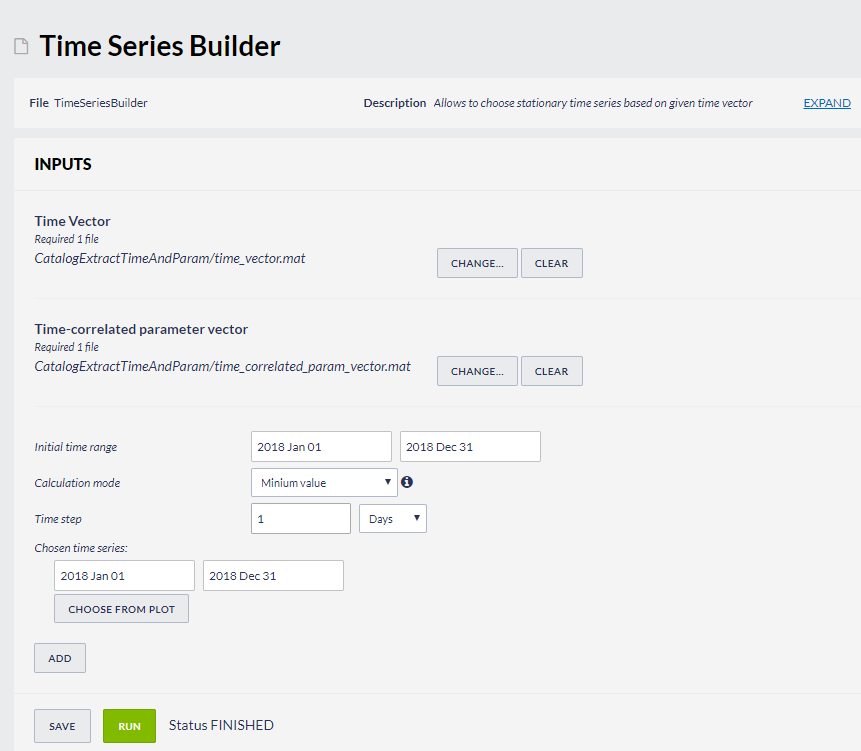
In the following steps the user needs to specify:
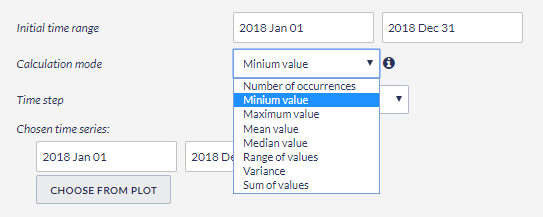
- Initial time range – initial time range for analysis
- Calculation mode – specifies way of parameter calculation from the time-correlated parameter vector values to compute time series (see figure below)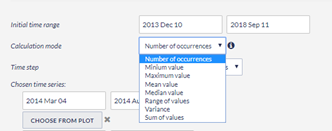
- Time step - time step in which analysis will be performed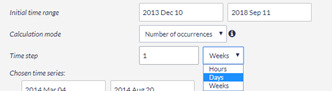 used for the analysis (see figure below)
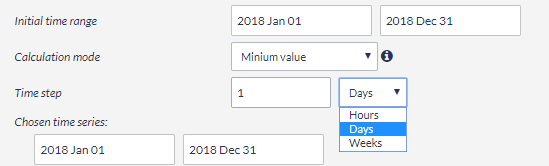
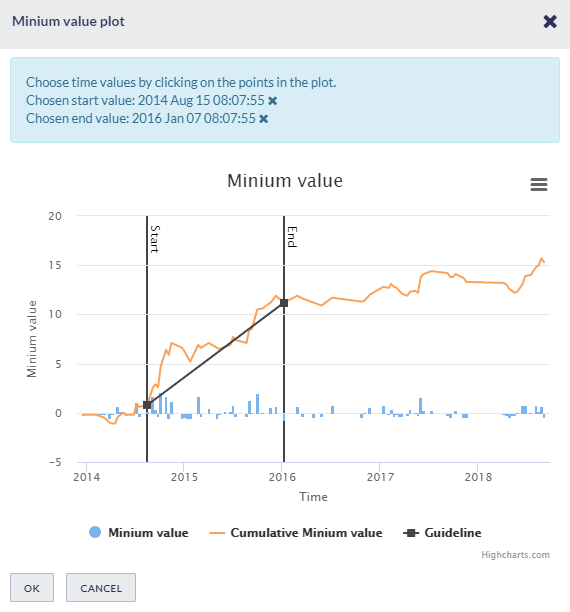
- Chosen time series – select a single or multiple ranges range(s) of time for which time series will be calculated. It can be typed manually or selected from interactive graphs .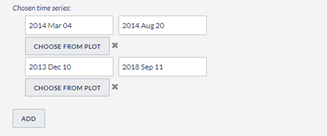
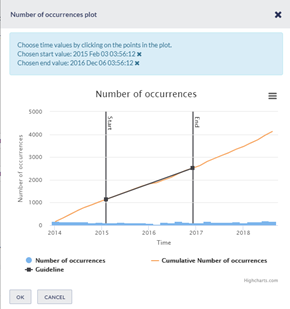 (see figures below)
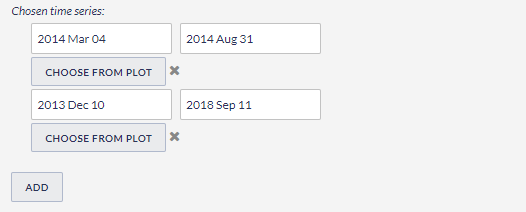
Press the Run button button to initiates initiate the process. Time series are calculated and saved in the user’s workspace as .mat file.

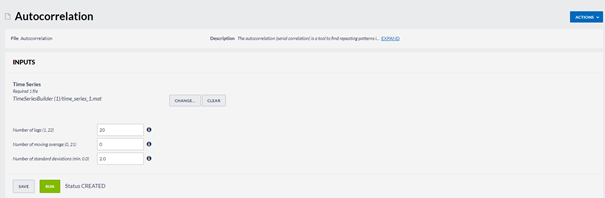
- Add Autocorrelation application to the workspace. The mandatory input is the time series file generated in the previous step. User can also specify additional parameters of autocorrelation function .
As the output, application generated the plot of autocorrelation function calculated for user defined parameters: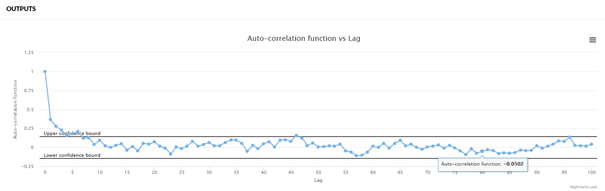 (see figure below)
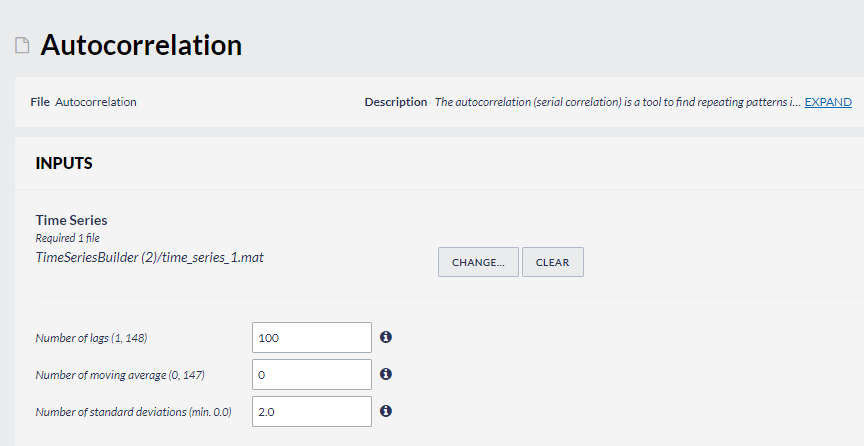
Launch the application by pressing the button.
The main output from the application is a plot of the autocorrelation function calculated using the specified parameters: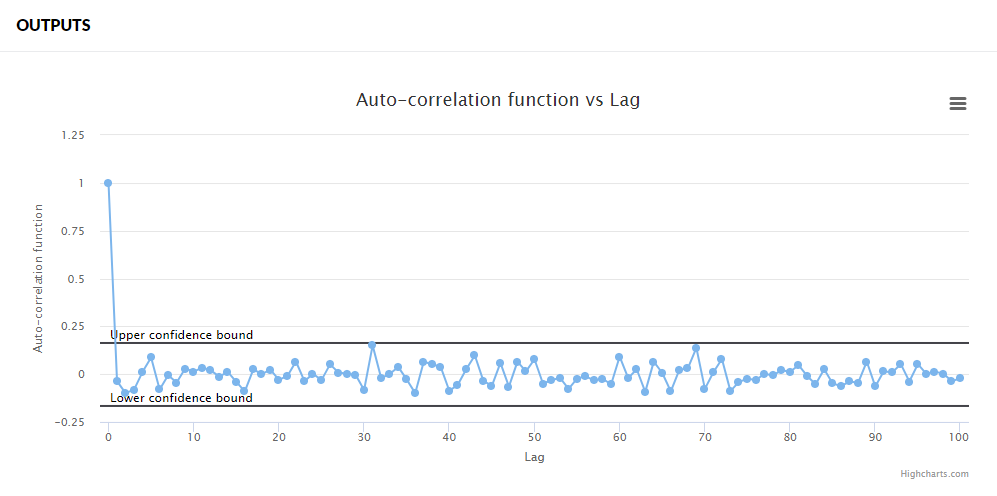

Overview
Content Tools