Page History
| Anchor | ||||
|---|---|---|---|---|
|
| Info |
|---|
The Cross Correlation is a measure of similarity of two data series as a function of the displacement of one relative to the other. https://tcs.ah-epos.eu/#apps:Crosscorrelation |
REFERENCES Document Repository
CATEGORY
REFERENCES
Document Repository
CATEGORY
Correlation Analysis
KEYWORDS
KEYWORDS Statistical analysis, Statistical properties of seismicity, Geo-resource production impact, Production – seismicity interaction
CITATION
CITATION Please acknowledge use of this application in your work:
IS-EPOS. (2017). Cross Correlation [Web application]. Retrieved from https://tcs.ah-epos.eu/
Step by step
In order to use the Cross Correlation application the user must have a time series data available in the workspace. This is the mandatory input to the application. The time series data can be easily created with other tools available on the IS-EPOS platformEPISODES Platform, as described below.
The workflow for Crosscorrelation application:
- Choose the catalog (or extract part of the catalog with Catalog Filter) from the episode that analysis is to be performed fora selected episode.
- Add to your user's workspace the Catalog Time and Correlated parameter extractor applicationto Vector converter application. It allows to extract vectors of time and time–correlated attributes of your user's choice from the seismic catalog.
Select the seismic catalog to be used and choose the parameter you would like to conduct the analysis for (parameters to be analyzed: a column with time and any parameter from the Catalog for which the correlation is to be made (Time and eg. Mw).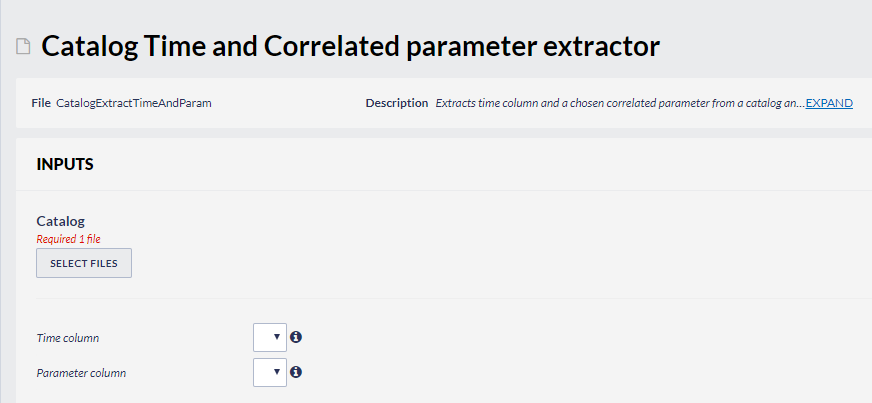
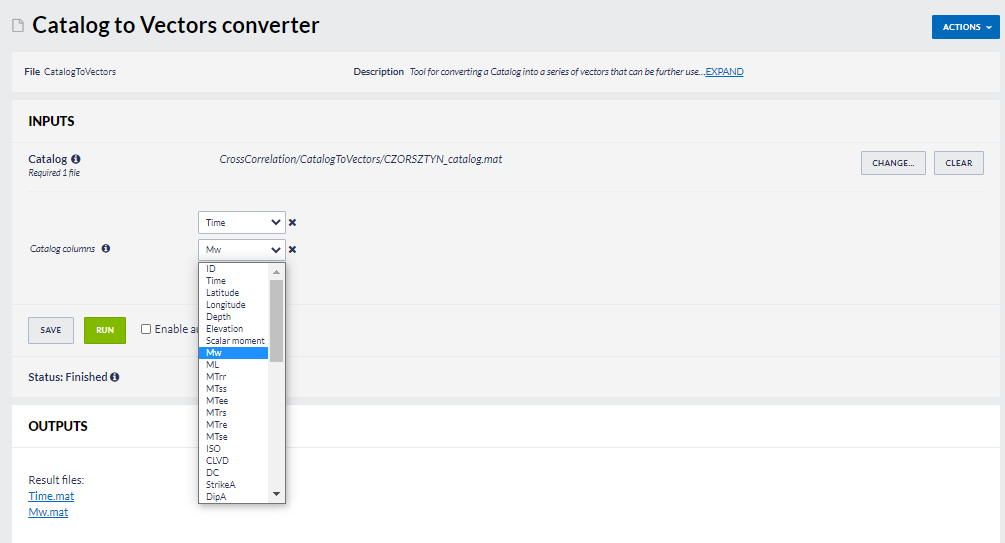
- The application generates two files: time_vectorTime.mat and time_correlated_param_vector [chosen parameter name].mat. These are input files to the Time Series Builder application that user should to use next.
- Add the Time Series Builder to your the workspace. This application allows user to generate data series based on time vector and time-correlated parameter vector files created in the previous step (see figure below).
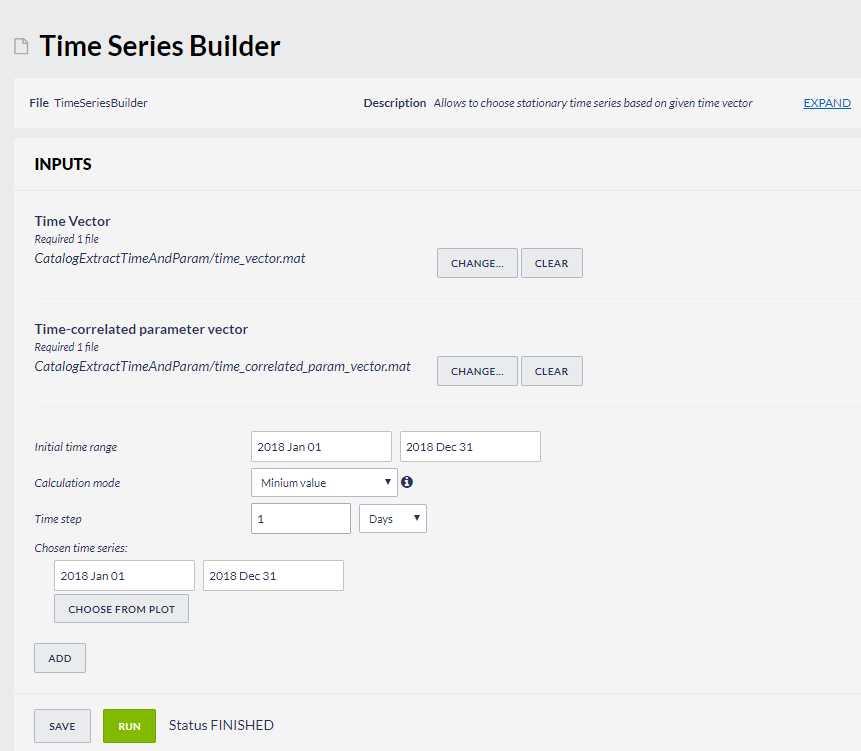
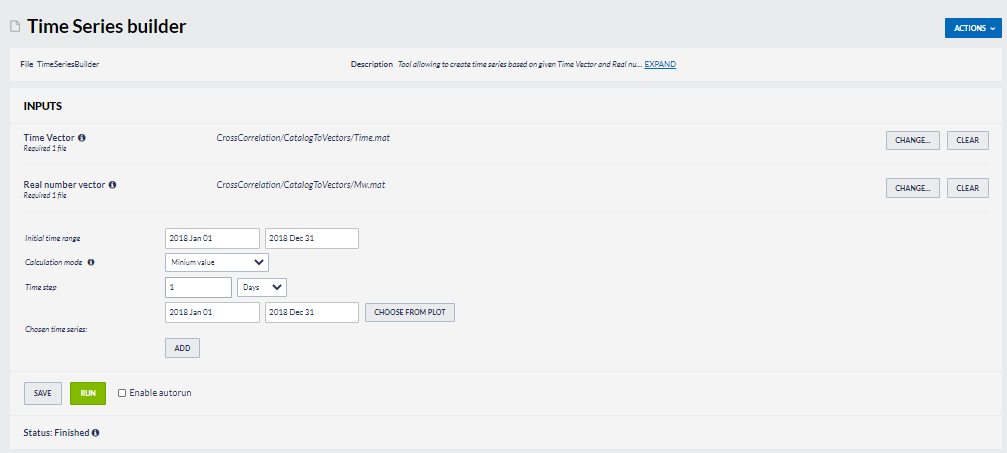
In the following steps user needs to specify:
- Initial time range – initial time range for analysis
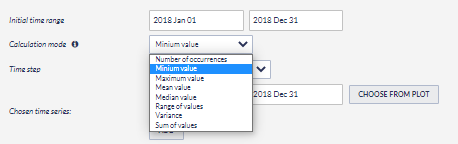
- Calculation mode – specifies way of parameter calculation from the time-correlated parameter vector values to compute time series (see figure below)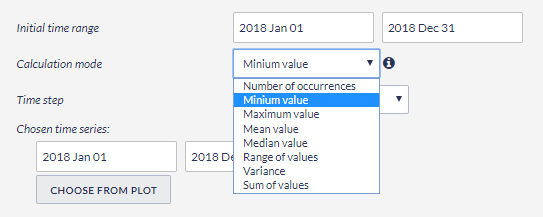
- Time step - time step in which analysis will be performed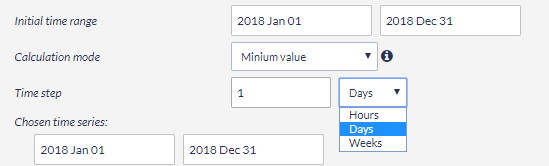 used for the analysis (see figure below)
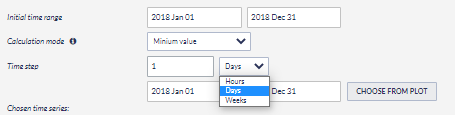
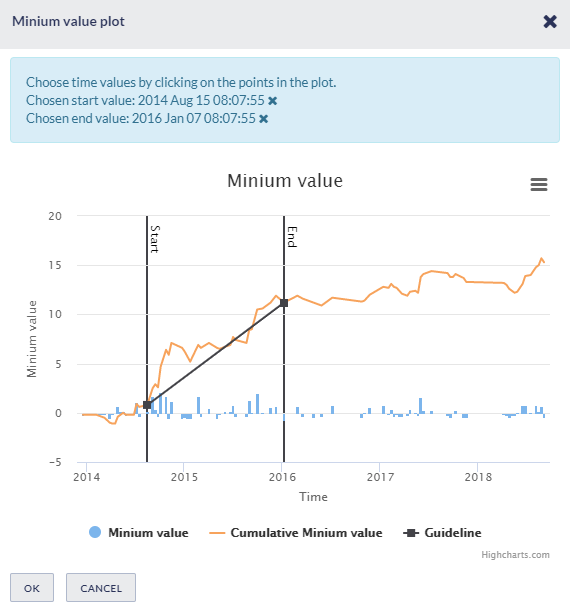
- Chosen time series – select a single or multiple ranges range(s) of time for which time series will be calculated. It can be typed manually or selected from interactive graphs .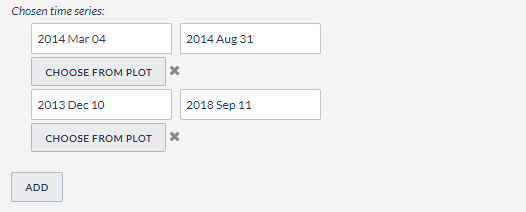 (see figure below)
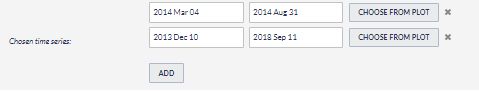
Press the button to initiates initiate the process. Time series are calculated and saved in the user’s workspace as .mat file.
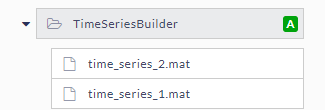
- Add Cross Correlation application to the workspace. The mandatory input are the time series files generated in the previous step. Two time series files are required. They can come from may belong to the same episode (eg. two time series from a different period of time) or come from separate different episodes.
User can also specify additional parameters of crosscorrelation function. function (see figure below)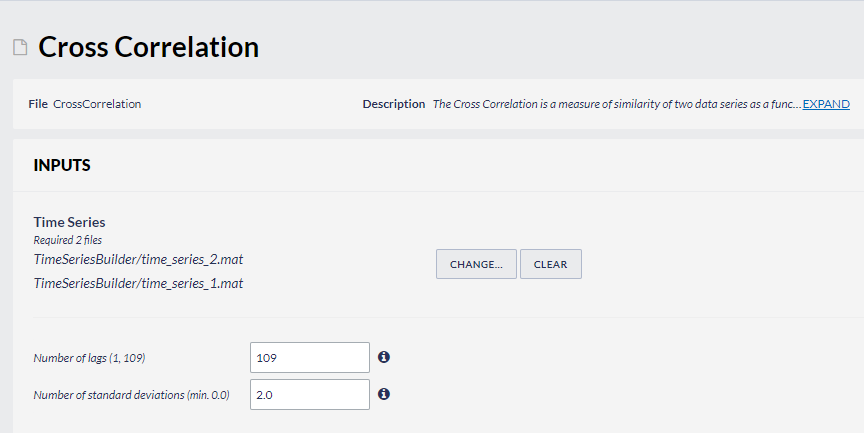
Select time series files holding the Ctrl button: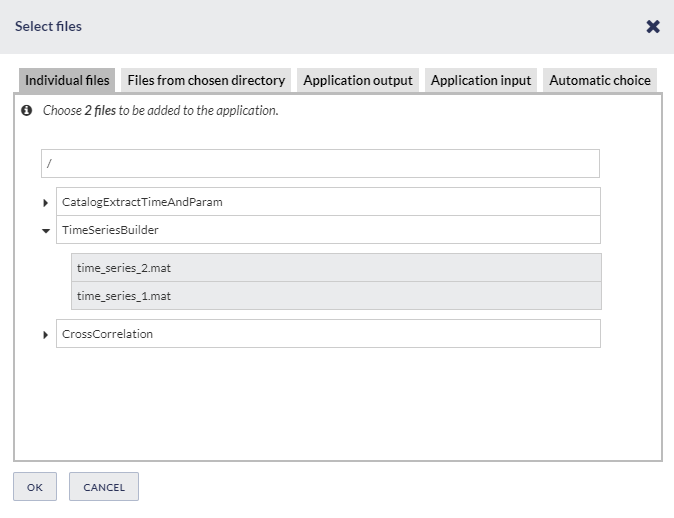
Luanch Launch the application by pressing the button.
The main output from the application is a plot of the crosscorrelation function calculated based on the specified specified parameters (see figure below):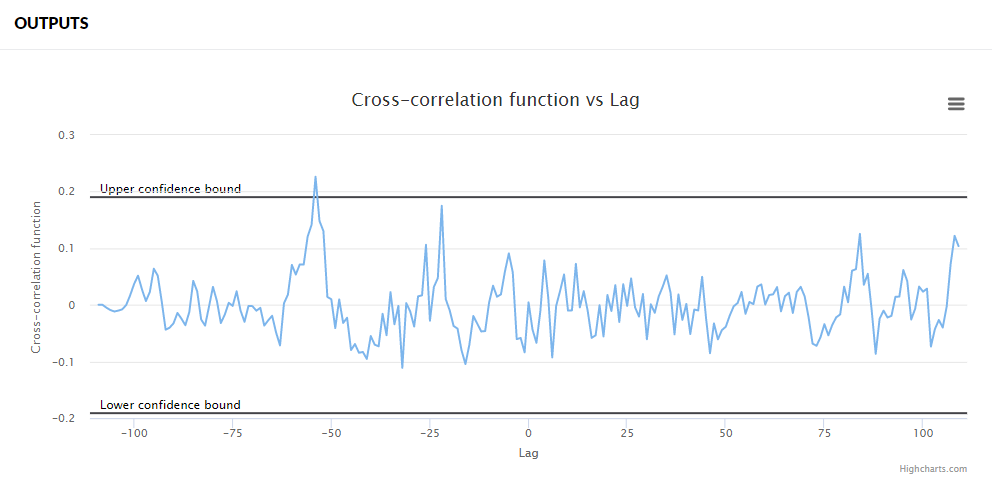

Overview
Content Tools