Page History
| Anchor | ||||
|---|---|---|---|---|
|
| Info |
|---|
Application for drawing histograms and cumulative histograms of events count and seismic energy for selected bins, the width of which corresponds to a constant value of the mining front advance. Calculations are performed from the beginning of the excavation along the axis of the excavation. |
REFERENCES
CATEGORY Visualizations
KEYWORDS Episode-oriented graphics, Production data visualization
CITATION Please acknowledge use of this application in your work:
IS-EPOS. (2015). Front Advance Histograms [Web application]. Retrieved from https://tcs.ah-epos.eu/
Step by Step
The data needed for this application comes from the "AH Episodes" and in particular 'Bobrek Mine seismic catalog' and 'Bobrek Mine mining front advance', as depicted in Figure 1. Any other, previously filtered, catalog can be introduced as well. In addition, the front window size is requested to be entered by the user (in meters).

Figure 1. Input for the visualization.
After running of the application is finished successfully the User sees two histograms ('events histogram' - above, 'energy histogram' - below) as shown in Figure 2. The User may select Histogram type between 'Histogram' (interval histogram) and 'Cumulative histogram' (red field in Figure 2). Zooming in/out histogram plotting is available for both events and energy charts. Options for linear/logarithmic scale of the x-axis and y-axis are available only for 'energy histogram'. The results are also available in numerical format.
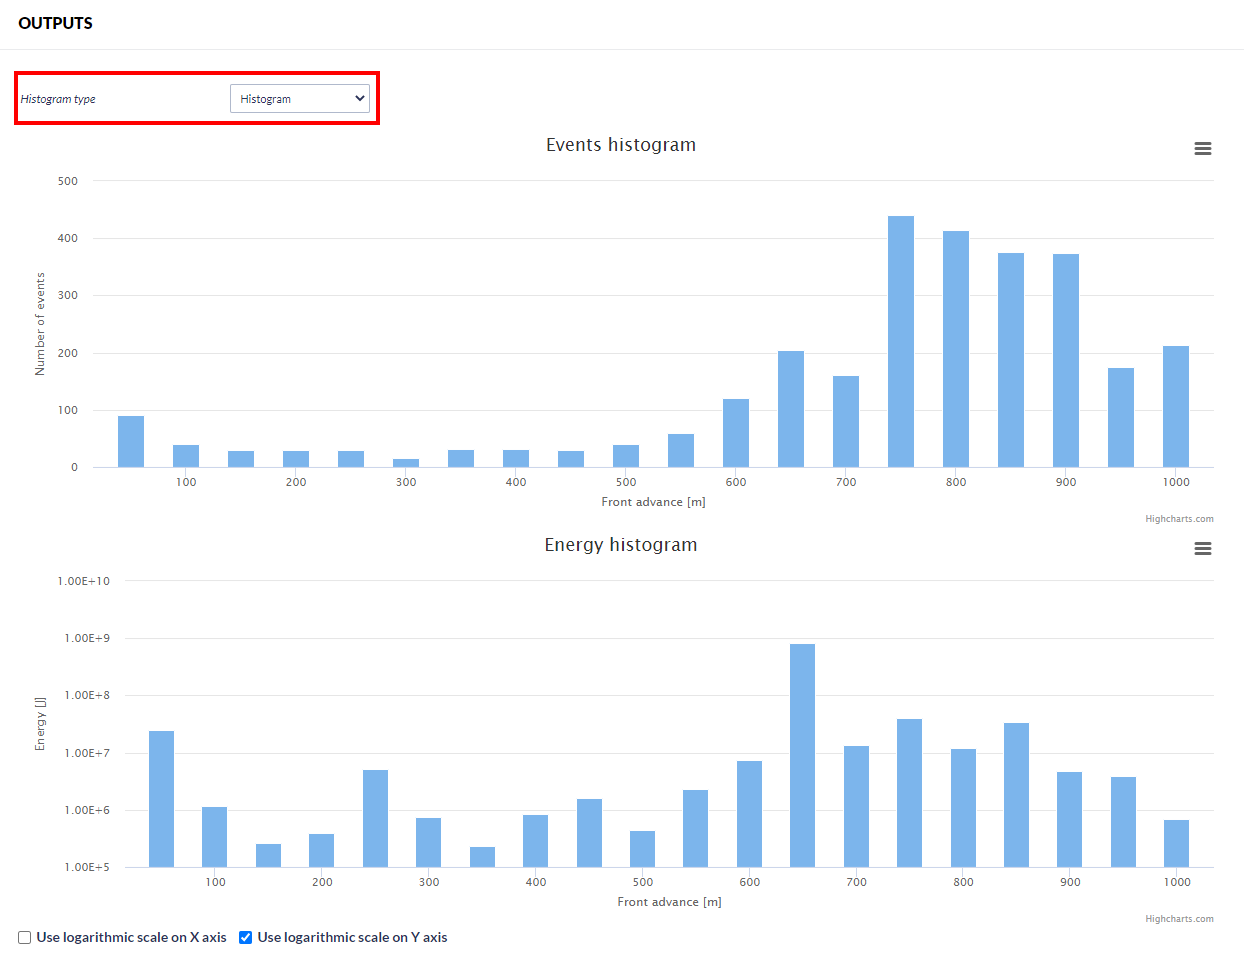
Figure 2. Output of the visualization.
![]()
Related Documents
| Content by Label | ||||||||||||||||
|---|---|---|---|---|---|---|---|---|---|---|---|---|---|---|---|---|
|
Overview
Content Tools