Page History
Step by step
In order to use the Autocorrelation application user must have a time series data available in the workspace. This is the mandatory input to the application. The time series data can be easily created with other tools available on the IS-EPOS platform, as described below.
The flow for using Autocorrelation application:
- Choose the catalog (or extract part of the catalog with Catalog Filter) from the episode that analysis is to be performed for.
- Add to your workspace the Catalog Time and Correlated parameter extractor application. It allows to extract vectors of time and time–correlated attribute from the seismic catalog. Select seismic catalog you would like to use and choose the parameter you would like to conduct the analysis for (eg. Mw).
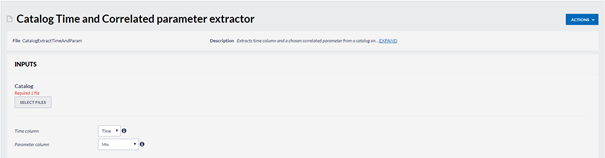
The application generates two files: time_vector.mat and time_correlated_param_vector.mat. These are input files to the Time Series Builder application that user should to use next. - Add Time Series Builder to your workspace. This application allows user to generate data series based on time vector and time-correlated parameter vector files created in the previous step.
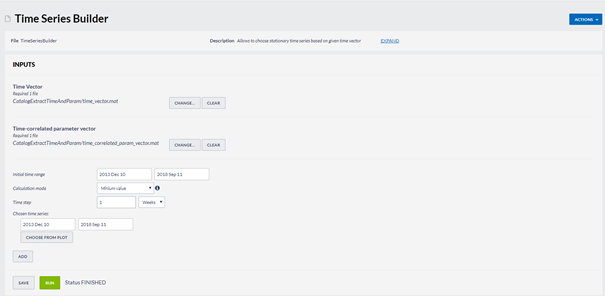
In the following steps user needs to specify:
- Initial time range – initial time range for analysis
- Calculation mode – specifies way of parameter calculation from the time-correlated parameter vector values to compute time series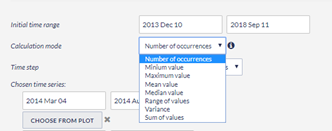
- Time step - time step in which analysis will be performed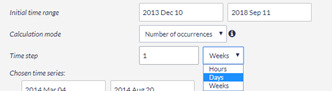
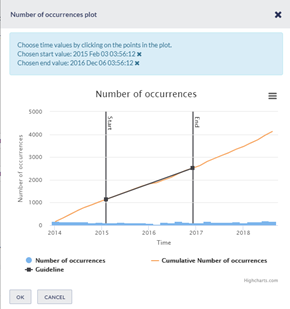
- Chosen time series – select a single or multiple ranges of time for which time series will be calculated. It can be typed manually or selected from interactive graphs.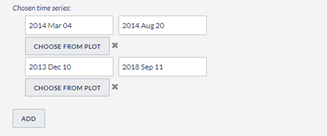
Press the Run button to initiates the process. Time series are calculated and saved in the user’s workspace as .mat file.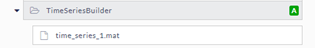
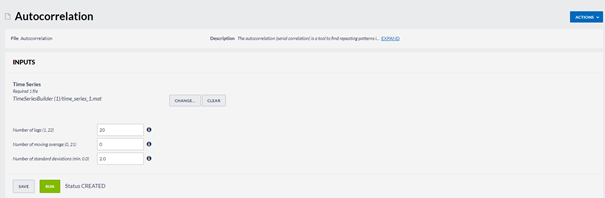
- Add Autocorrelation application to the workspace. The mandatory input is the time series file generated in the previous step. User can also specify additional parameters of autocorrelation function.
As the output, application generated the plot of autocorrelation function calculated for user defined parameters: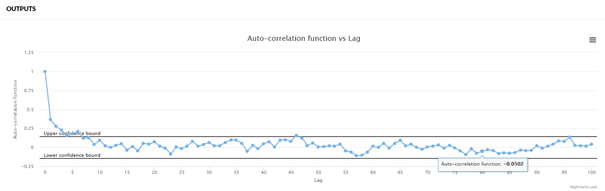
Related Documents
| Content by Label | ||||||||||||||||||
|---|---|---|---|---|---|---|---|---|---|---|---|---|---|---|---|---|---|---|
|
Overview
Content Tools