Page History
| Anchor | ||||
|---|---|---|---|---|
|
| Info |
|---|
This Application performs testing of hypothesis of multimodality and existence of multi-bumps in a given magnitude distribution. Details on the methodology can be found in the document repository.
|
REFERENCES Code Repository, Document Repository
CATEGORY Statistical Properties of Seismicity
KEYWORDS Statistical analysis, Statistical properties of seismicity, Parameter probabilistic distribution
CITATION Please acknowledge use of this application in your work: IS-EPOS. (2019).Test for multimodal magnitude distribution[Web application]. Retrieved from https://tcs.ah-epos.eu/
Step by Step
After the User adds the Application into his/her personal workspace, the following window appear on the screen (Figure 1):
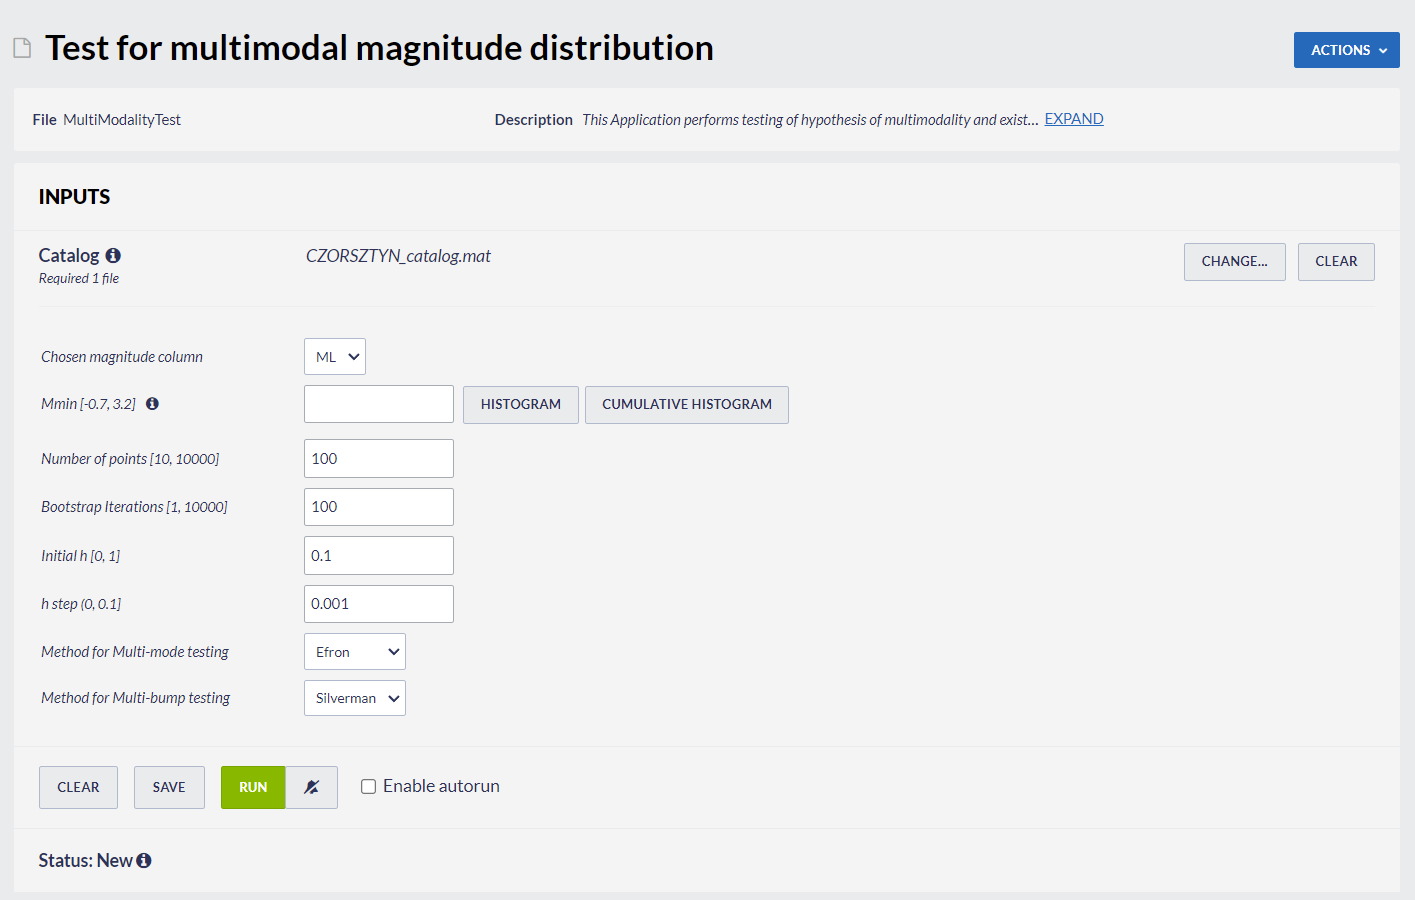
Figure 1. Input window of the "Test for Multimodal Magnitude Distribution" application.
The User shall click on 'SELECT FILES' button in order to use seismic catalog data among the ones that are already uploaded in his/her personal workspace.
The User is then requested to fill in the fields shown below:
- Chosen magnitude column - The user may choose among different magnitude scales (e.g ML, MW), in the Episodes where these scales are available.
- Mmin -The User now is requested to choose the minimum magnitude (completeness level of the catalog). This can be done in two ways. The first is to type a single magnitude value in the empty box, possibly after he/she has performed an individual analysis (see "Completeness Magnitude Estimation" Application). The second is to graphically select the minimum magnitude from the Normal or the Cumulative histograms, which are available after clicking on the respective tabs. In both cases there is option to alter the step of the histogram's bars and to select between linear and logarithmic scale of the Y-axis for the plotting.
- Number of points - The User is requested to enter number of points to divide the sample (magnitude vector).
- Bootstrap Iterations - The User is requested to define the number of bootstrap iterations for Multi-Mode as well as Multi-Bump testing.
- Initial h - The User is requested to select the initial value of the smoothing factor to apply in defining the critical h for the Multi-Mode testing process .
- h step - The User is requested to define the step (accuracy of hcrit) in defining the critical h for the Multi-Mode and Multi-Bump testing processes.
- Method for multi-mode testing - The User is requested to select the method for Multi-Mode testing.
- Method for multi-bump testing - The User is requested to select the method for Multi-Bump testing.
The default values and the possible range of the inputs are provided by the application as shown in the example of Figure 1.
After defining the aforementioned parameters, the user shall click on the 'RUN' button and the calculations are performed. The Status changes from 'Submitting' through 'Queued', than 'Running' and finally 'Finished'. The output is created and plotted in the main window just below 'RUN' button. The Analysis Results table appear on the screen and comprise 3 individual outputs:
A) multi_modality_chart_data.mat: This output includes 3 figures (e.g. the one shown in figure 2). The first figure shows the Probability Density Function (pdf) of Magnitudes for h=h_critical (Figure 2). The second and third figures show the 1st and 2nd derivatives of the aforementioned magnitude pdf. The location of the extremum and inflection points are also indicated in the plot. The figures can be downloaded in different formats (e.g. *.jpg, *png).
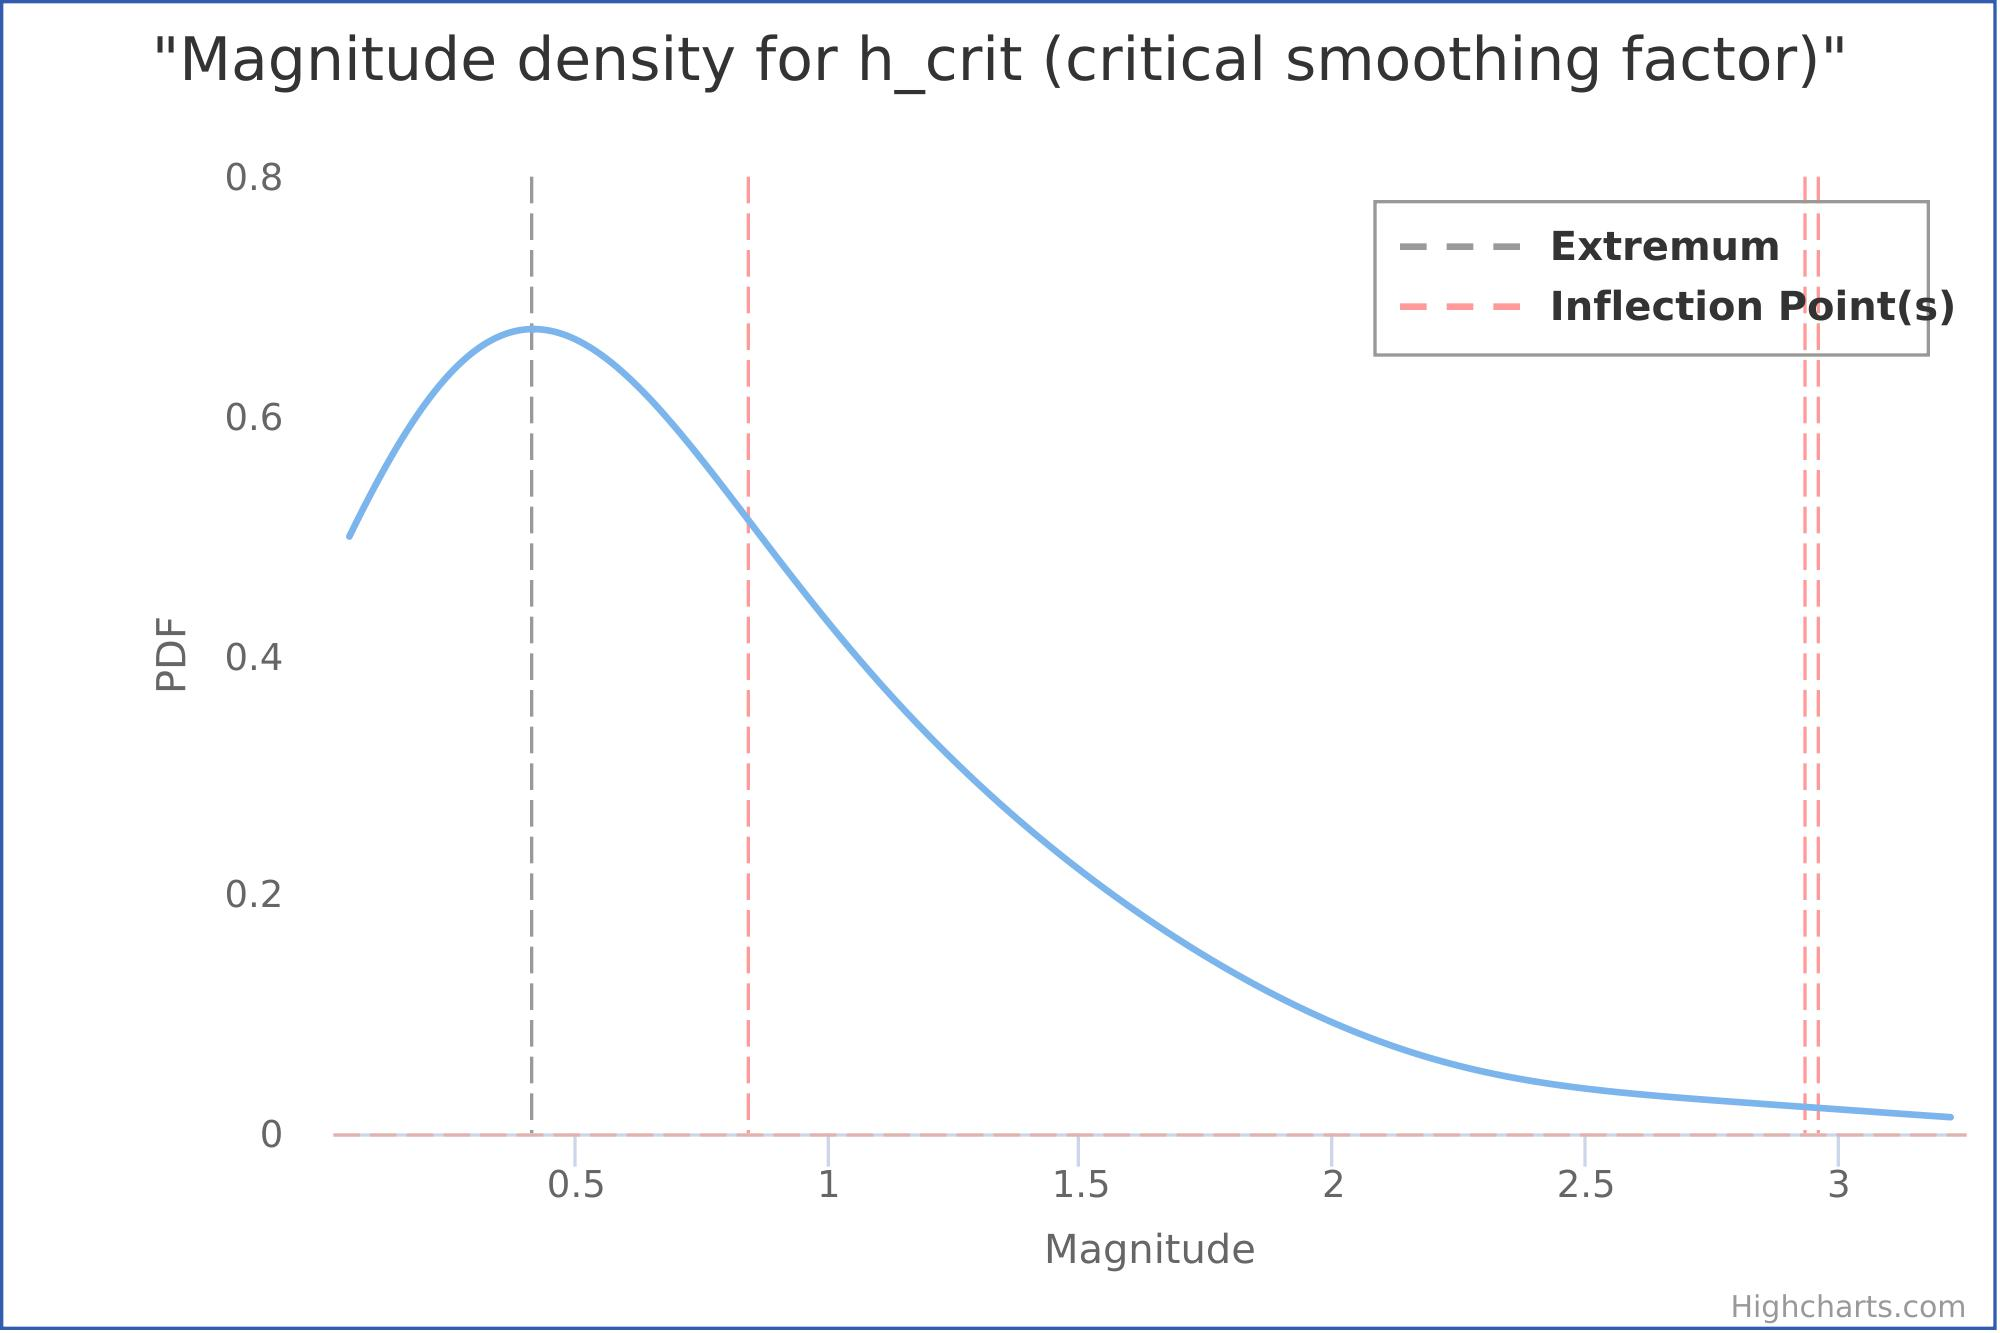
Figure 2. Sample output figure (Magnitude PDF) generated by the Application.
B) multi_modality_report_data.mat: This is a matlab file with the results of the application (figure 3). Note that for the last 2 parameters (p-values), when their value is less than 0.05, then the corresponding null hypothesis can be rejected at 0.05 significance.
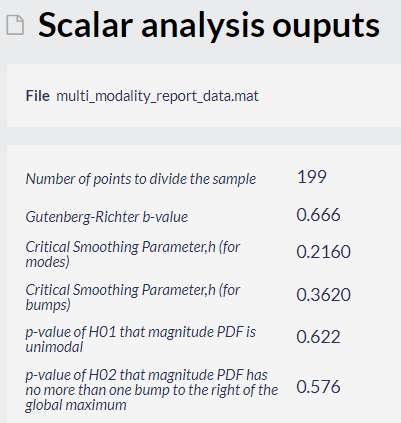
Figure 3. Outputs generated by the Application.
C) Report_Multimodality.txt: This is an ASCII file with a summary of the input parameters and results (Figure 4).
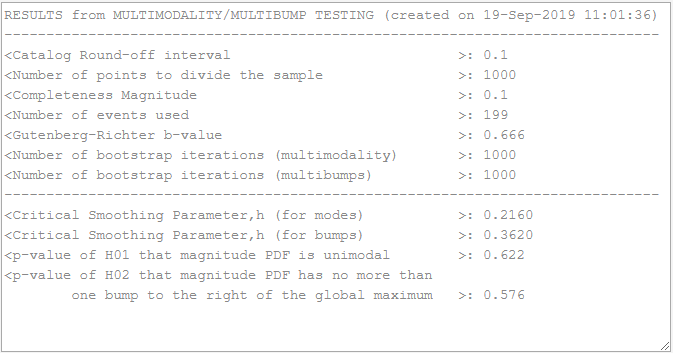
Figure 4. Output Report generated by the Application.

Overview
Content Tools