Page History
| Info |
|---|
This application performs cluster analysis in multi-dimension space. The Application can use as input the output structure from the “t2ed_output.mat" produced by Transformation to Equivalent Dimensions Application therefore all analyses are performed within the Equivalent Dimension phase (parameter) space. |
REFERENCES Code Repository
CATEGORY Data Processing Applications
KEYWORDS Data clustering, Production-seismicity interaction, Statistical analysis
CITATION Please acknowledge use of this application in your work: IS-EPOS. (2019). Cluster Analysis [Web application]. Retrieved from https://tcs.ah-epos.eu/
Step by Step
After the User adds the Application into his/her personal workspace, the following window appears on the screen (Figure 1):
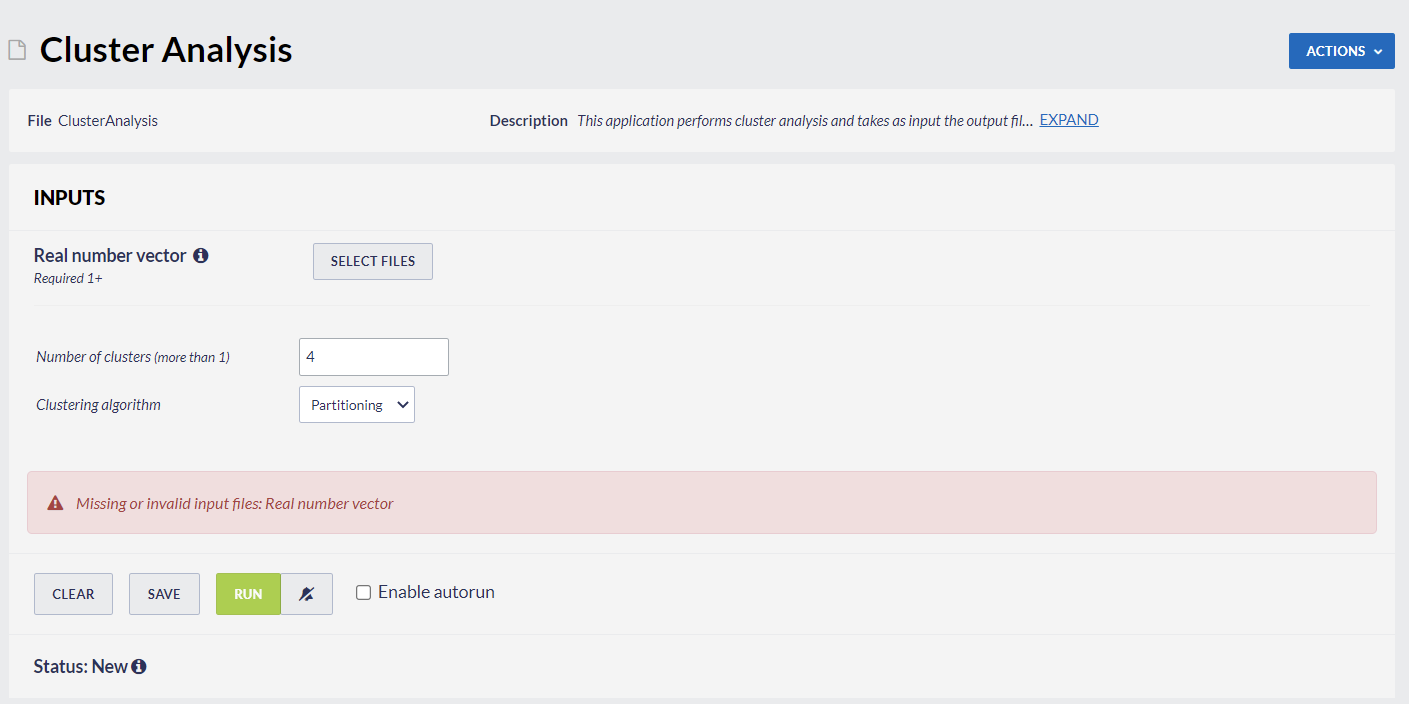
Figure 1. Input of the "Cluster Analysis" application.
The User is now requested to fill the fields shown in Figure 1 (from top to bottom):
- Real number vector - The User may click on "SELECT FILES" button in order to use a data files among the ones that are already uploaded or created within his/her personal workspace. It is strongly recommended to use as input the output file created by "Transformation to Equivalent Dimensions" application. After successfully running "Transformation to Equivalent Dimensions" application the User may click on "PERFORM CLUSTER ANALYSIS" button at the bottom of the Outputs (red filed in Figure 2) to perform analysis on the output file from "Transformation to Equivalent Dimensions" application (Figure 3).
- Number of clusters – The User enters the number of cluster within which the entire data sample will be divided. The number must be an integer greater than 1.
- Clustering algorithm – The User may select between 2 clustering algorithms, namely "Partitioning" clustering (K-means algorithm) or "Hierarchical" algorithm (Ward’s method). "Fuzzy" clustering is not supported yet in EPISODES Platform.
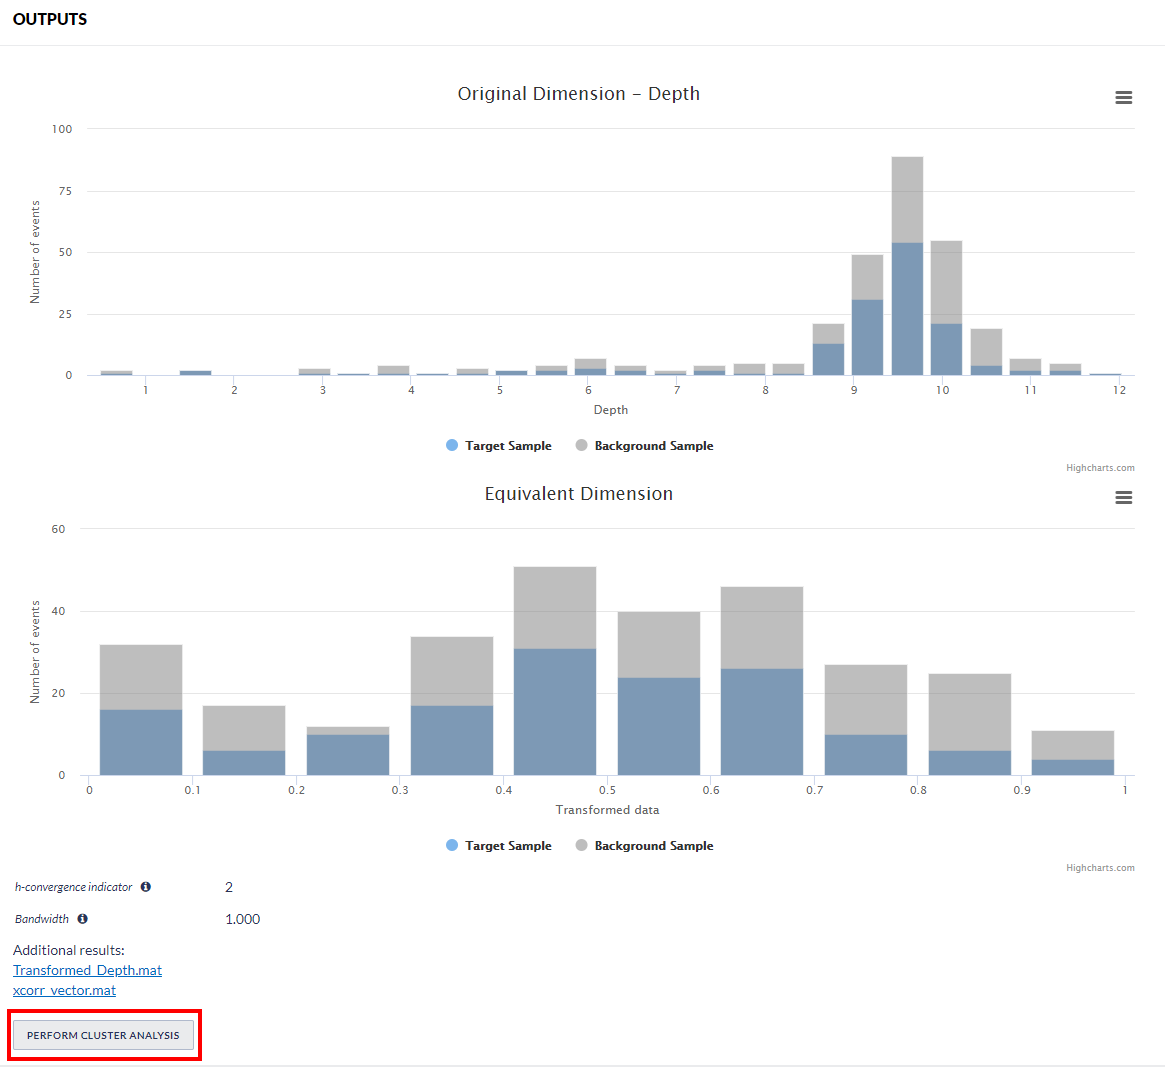
Figure 2. Outputs of the "Transformation to Equivalent Dimensions" application.
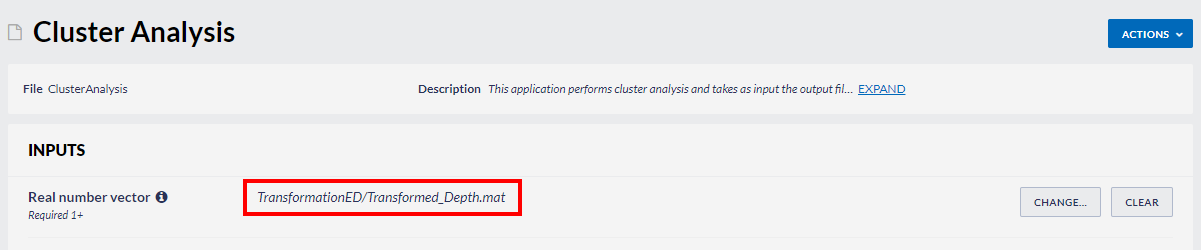
Figure 3. Output file from the "Transformation to Equivalent Dimensions" application as an input for the "Cluster Analysis" application.
The Analysis Results table appear on the screen and comprise the following outputs:
- Summary report (Figure 4, red frame) with the number of events included in each cluster created together with the center of mass of each cluster in each one of the dimensions in the selected parameter phase space (in Equivalent Dimensions, therefore ranging between 0 to 1). If the phase space has 2 or 3 Dimensions (2 or 3 parameters have been selected for cluster analysis), then an additional 2D or 3D plot in the corresponding phase space is also created (Figure 4). The summary report is also available and can be downloaded as mat file (cluster_analysis_out_cluster.mat).
A matlab structure with the transformed parameters of each event together with an index of the cluster to which each event belongs (structure saved as a mat file 'cluster_analysis_out_all_events.mat').
If Clustering algorithm “Hierarchical” is selected, a Ward diagram is produced as well showing the linkage distance among the events and the number of clusters created (Figure 5).
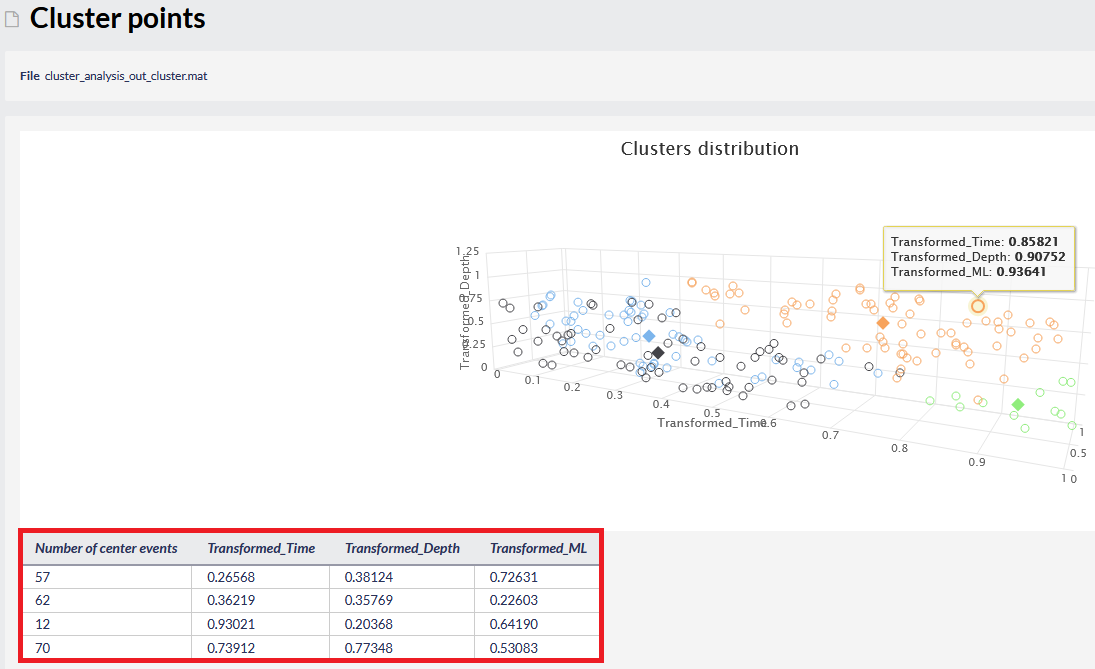
Figure 4. Output summary and 3D plot created by "Cluster Analysis" application.
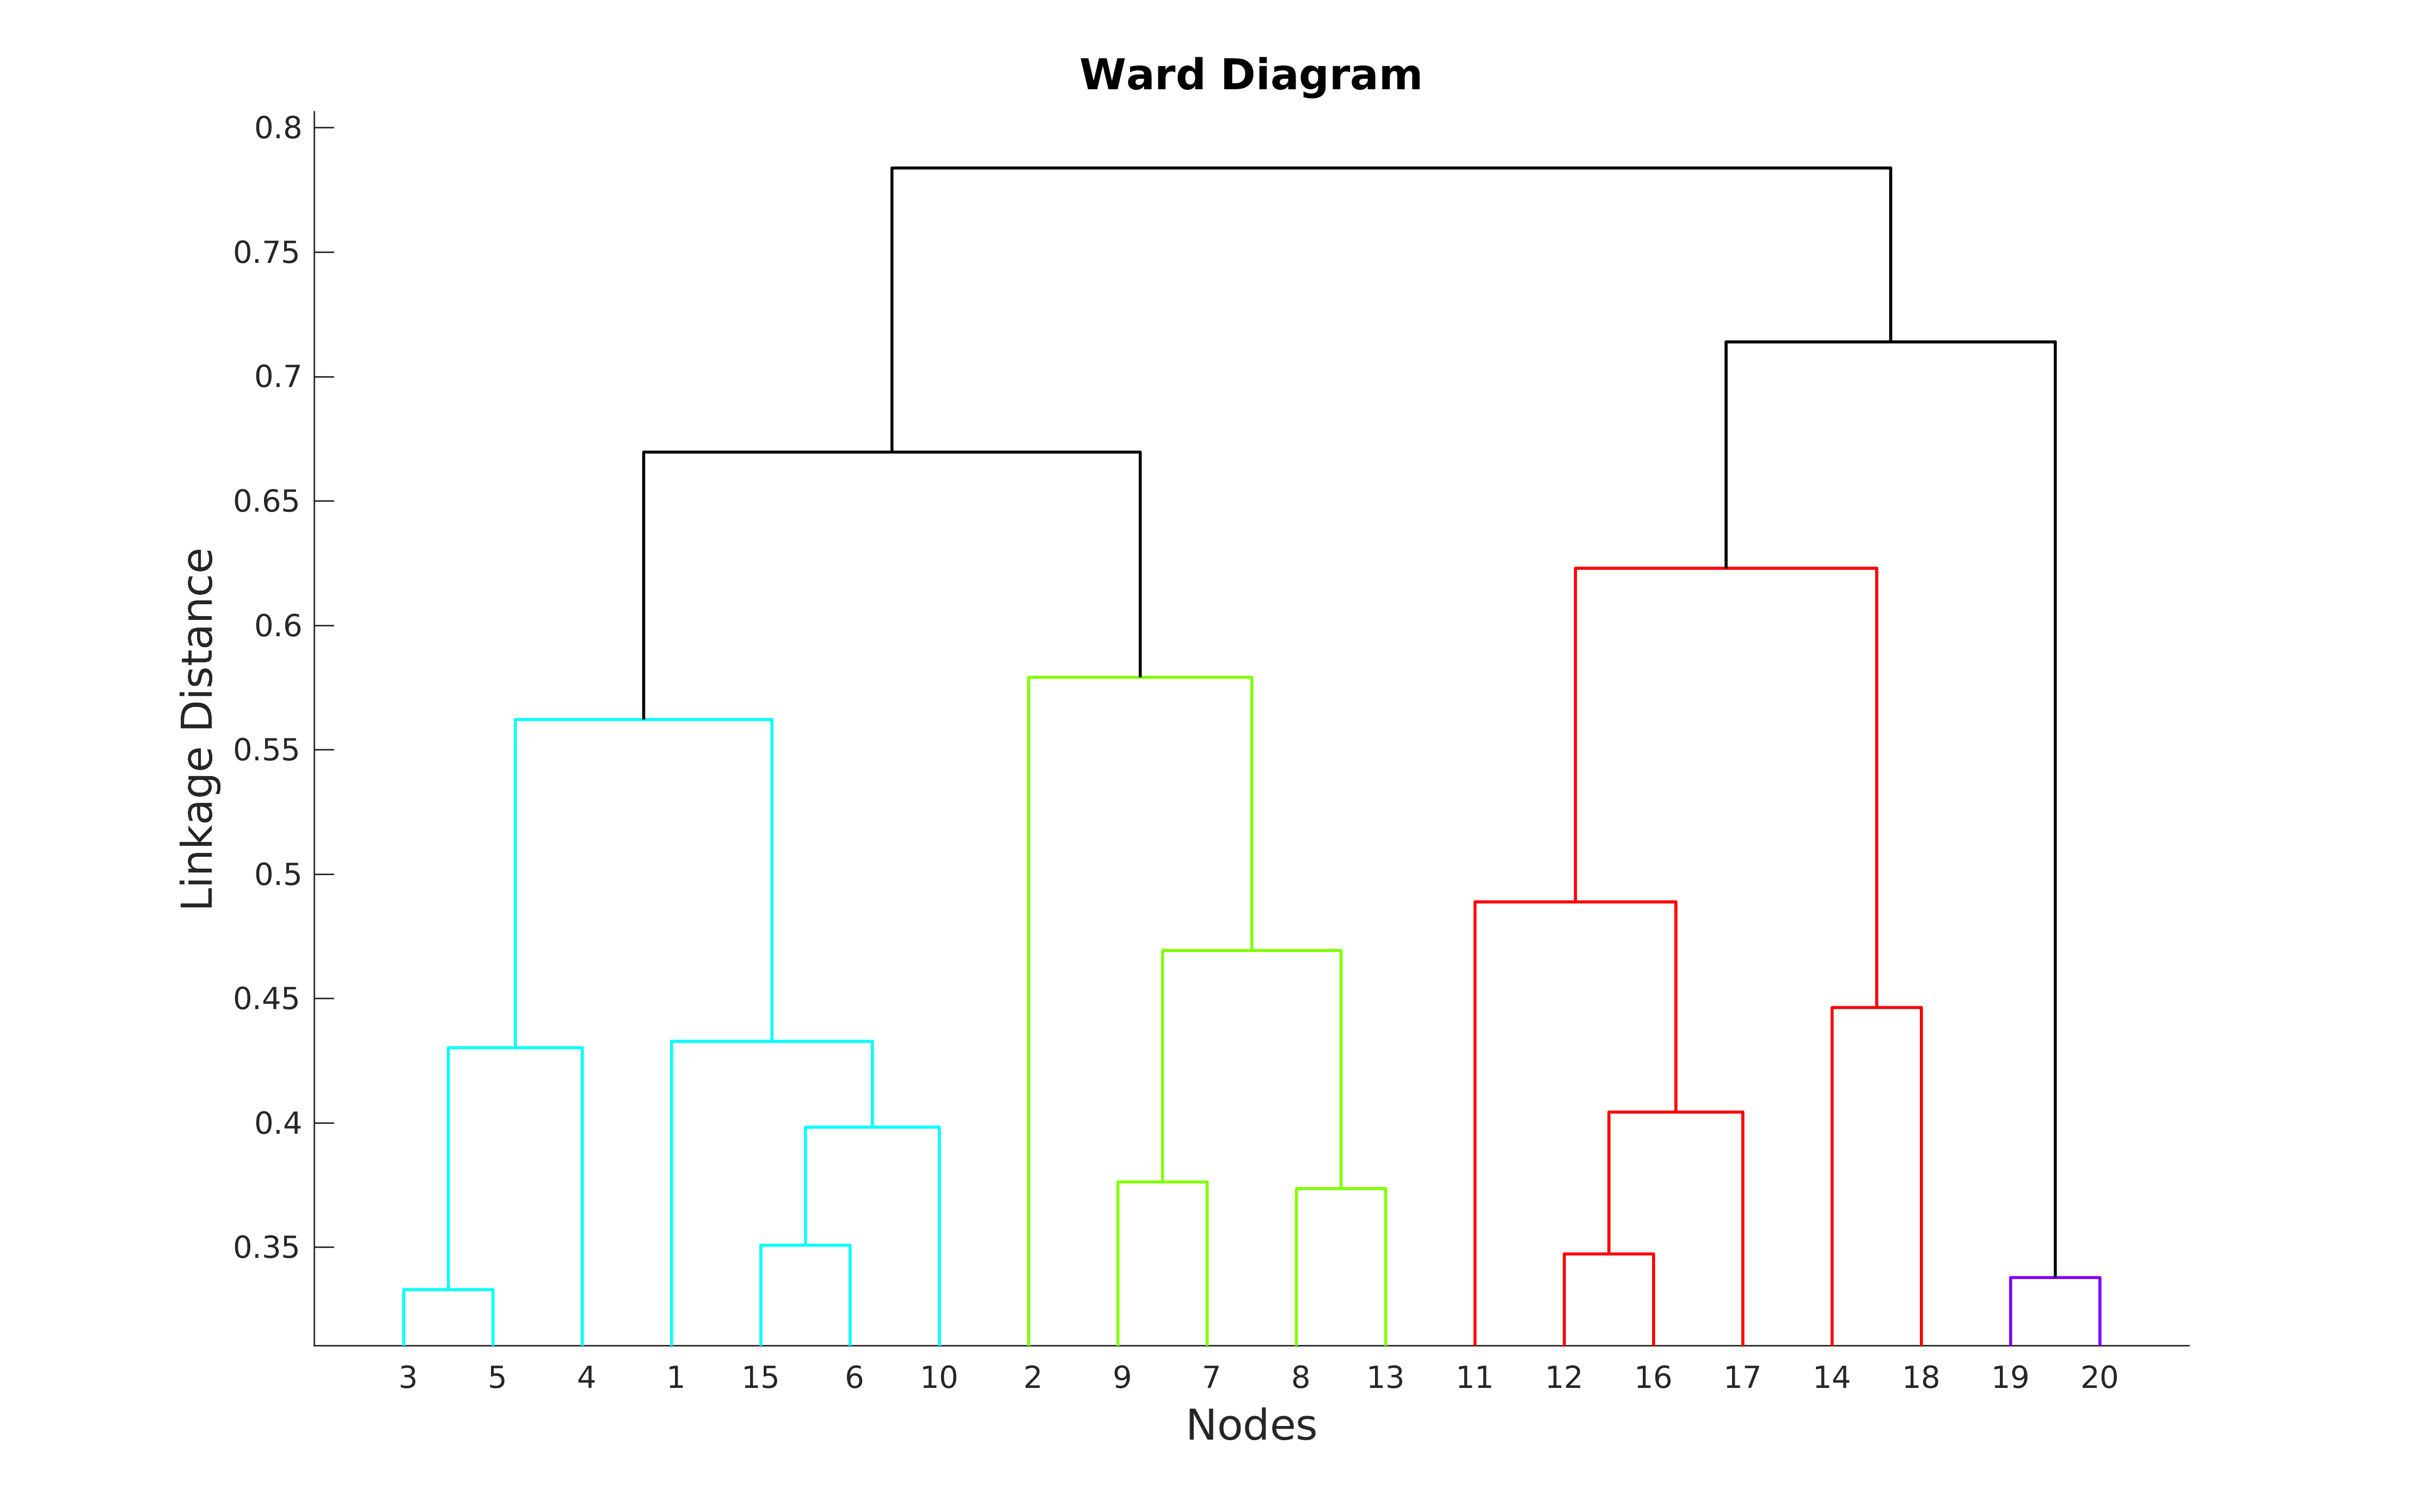
Figure 5. Output Dendrogram created by "Cluster Analysis" application, after "Hierarchical" clustering algorithm was selected.


Overview
Content Tools