Information
Scientific Background
Overall, the analyses of earthquake triggering whatever they are tectonic or anthropogenic seismicity point in time-space scale the key role of the use normalized distance versus absolute distance to relate a trigger to triggered event. For tectonic earthquakes, there are evidences that the use of the absolute distance captures earthquake- earthquake triggering patterns (as aftershock-mainshock pair) that hide the key properties of the mainshock-aftershock interactions (e.g. Bak et al 2002; Parsons and Velasco, 2009, Tahir et al., 2012, Tahir and Grasso, 2015, de Arcangelis et al 2016). This supports the link whereby the reservoir influence zone scales with reservoir (hydrocarbon field or reservoir lake ) size rather than with simple distance to a local “point-source” load, especially in the reservoir near field (e.g., Ibenbrahim et al., 1989, Grasso et al. 2018). Grasso et al. (2018) suggest that surface reservoir impoundment (onset of production for hydrocarbon field) impacts the upper crust in the same way as earthquake slip changes upper crust stresses. The surface reservoir load modifies the state of stress, specifically the vertical stress and the effective stresses, through pore-pressure changes, in an area that scales with Lr, the reservoir length (Grasso et al.2018). The same way goes for conventional hydrocarbon reservoir depletion (e.g. Segall et al. 1994).
This application proposes to estimate of Mmax on two different basis: (i) from the frequency of Mmax values as deduced the worldwide data base for the considered geo-resource production; it corresponds to a Mmax probability for a given time period; (ii) when available a second possible Mmax estimate is the one deduced from the size of the geo-resource production (representative length of the reservoir); (iii) Then the user must compared the two outputs to derive uncertainties.When using the reservoir size, (Lr) the reservoir length is converted to M using M(Lr) relationship for earthquake (e.g. Wells Coppersmith 1994). It provides an Mmax =M(Lr) estimate that is very conservative value as rarely (less than 5%) overpassed. A second estimated is the average (<Mmax>) Mmax estimate for a given Lr reservoir, that corresponds to <Mmax> = M(Lr) – 2 (e.g. Grasso et al. 2018a,b)Bak, P., Christensen, K., Danon, L., & Scanlon, T. (2002). Unified scaling law for earthquakes. Physical Review Letters, 88(17), 178501.De Arcangelis, L., Godano, C., Grasso, J. R., & Lippiello, E. (2016). Statistical physics approach to earthquake occurrence and forecasting. Physics Reports, 628, 1-91. J.‐R. Grasso, A. Karimov, D. Amorese, C. Sue, C. Voisin, (2018a) Patterns of Reservoir‐Triggered Seismicity in a Low‐Seismicity Region of France. Bulletin of the Seismological Society of America doi: https://doi.org/10.1785/0120180172
J.-R. Grasso, A. Karimov, D. Amorese, (2018b), Anthropogenic Seismicity as aftershocks of geo-resource production ? Implication for Mmax estimates, reservoir impoundment case, Geophysical journal international , submmitted Parsons, T., and A. A. Velasco (2009), On near-source earthquake triggering, J. Geophys. Res., 114, B10307, doi:10.1029/2008JB006277.Segall, P., J.R. Grasso, and A. Mossop, Poroelastic stressing and induced seismicity near the Lacq gas field, J. Geophys . Res., 99, 423-438, 1994.Tahir, M., Grasso, J. R., & Amorèse, D. (2012). The largest aftershock: How strong, how far away, how delayed?. Geophysical Research Letters, 39(4).Tahir, M., & Grasso, J. R. (2015). Faulting style controls for the space–time aftershock patterns BSSA2015 Wells, D. L., & Coppersmith, K. J. (1994). New empirical relationships among magnitude, rupture length, rupture width, rupture area, and surface displacement. BSSA 1994
Step by Step
How to use the application
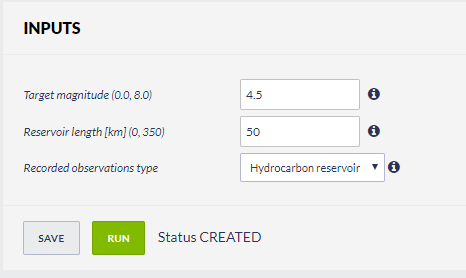
After the User adds the Application into his/her personal workspace, the following window appear on the screen (Figure 1):
Figure 1. Input window of estimate of maximum possible magnitude from induced deformation.

The user is now requested to fill the fields shown above:
1) Target magnitude - magnitude value to be used for possible Mmax distribution
2) Reservoir length – Length of the reservoir to be used for possible Mmax distribution
3) Input data – the user should choose one of the data: water reservoir or hydrocarbon reservoir. Both data come from HiQuake: The human-induced earthquake database. (2016) The data can be found online https://inducedearthquakes.org/
After defining the aforementioned parameters, the user shall click on the "Run" button and the calculations are performed. The Status changes from 'CREATED' through 'RUNNING' and finally 'FINISHED' and the output is created and plotted in the main window just below "RUN" button.
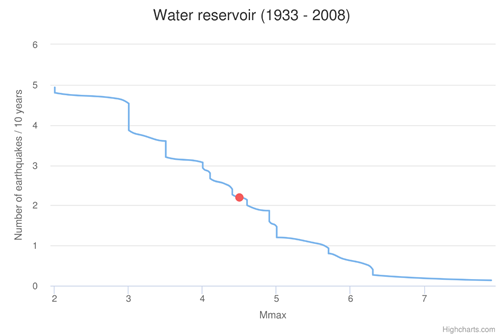
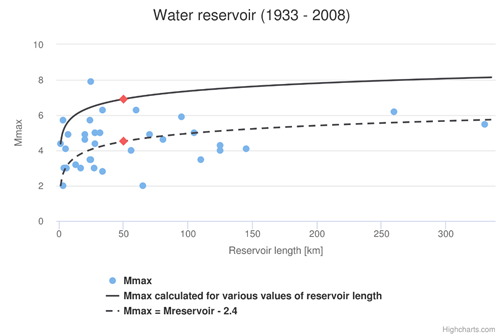
Figure 3 describes the outputs, possible Mmax estimation for water reservoir case.
Figure 3(a,b) The outputs of possible Mmax estimation for water reservoir case:
(a)

- red circle – occurrence probability for target magnitude
(b)

- solid line - distribution of Mmax (maximum magnitude) with the reservoir length (Wells and Coppersmith 1994)
- circle points - global reference events for the water reservoir case
- upper red diamond – expected maximum magnitude value, based on imposed reservoir length
- bottom red diamond – expected average magnitude value, based on imposed reservoir length.
- dashed line - the Bath law for a tectonic aftershock
- α - a priori constant; α = 2.2 and 2.4 for the water reservoir and hydrocarbon reservoir cases respectively.
Note user gets the same type of 2 output plots for hydrocarbon reservoir case.

