Step by Step
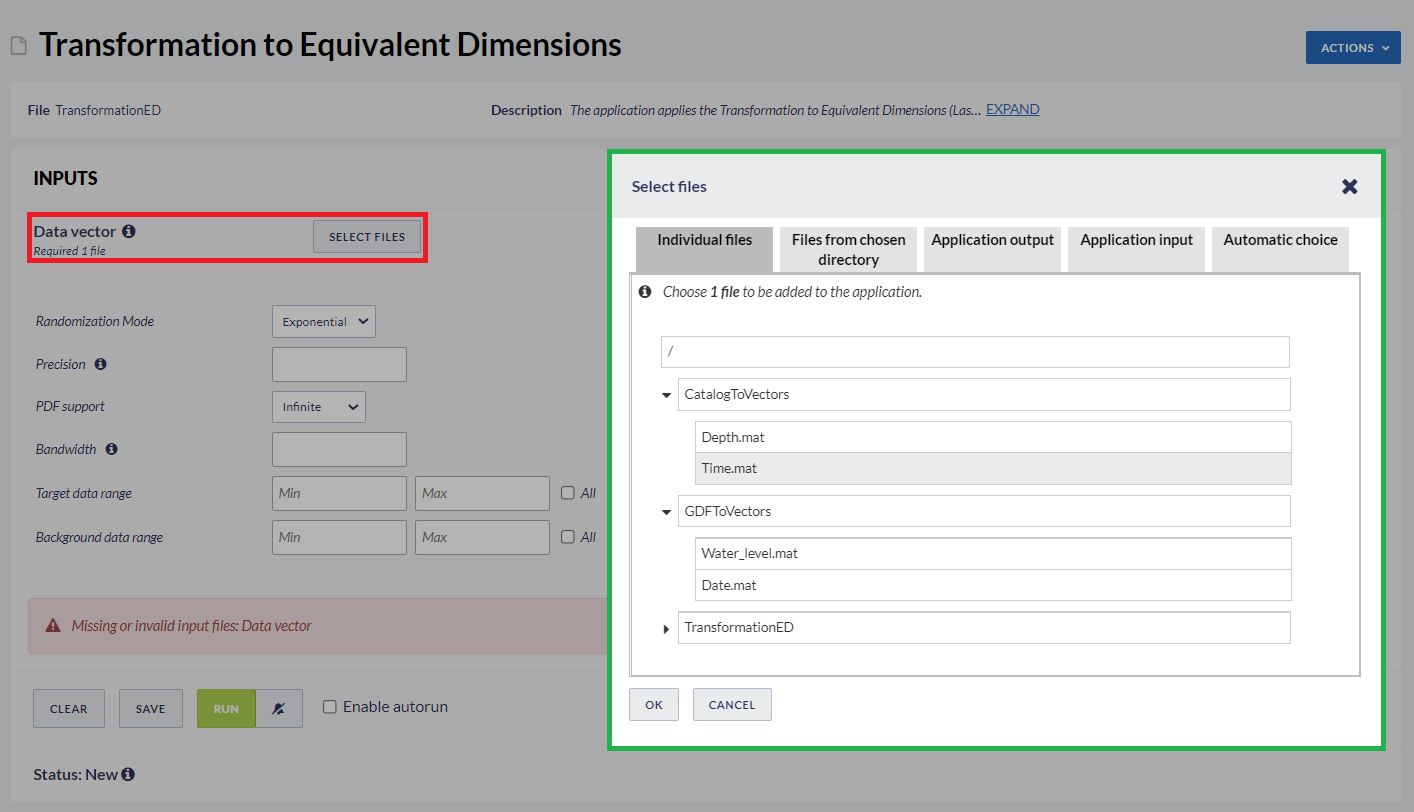
After the User adds the Application into his/her personal workspace, the following window appears on the screen (Figure 1):

Figure 1. Input data uploading file for the "Transformation to Equivalent Dimensions" application.
The User is requested to upload vector of either numerical or time values (red field in Figure 1) which is already available in his/her personal workspace (green field in Figure 1). However, if the User is not in possession of such file, he or she can generate one using "Catalog to Vectors" or "GDF to Vectors" converter, as shown in Figure 2.
Figure 2. Application input information
After clicking on the application input information (red field in Figure 2), the User can obtain vector of numerical or time values with the ”Catalog to Vectors converter” or the ”GDF to Vectors converter” applications (green field in Figure 2).

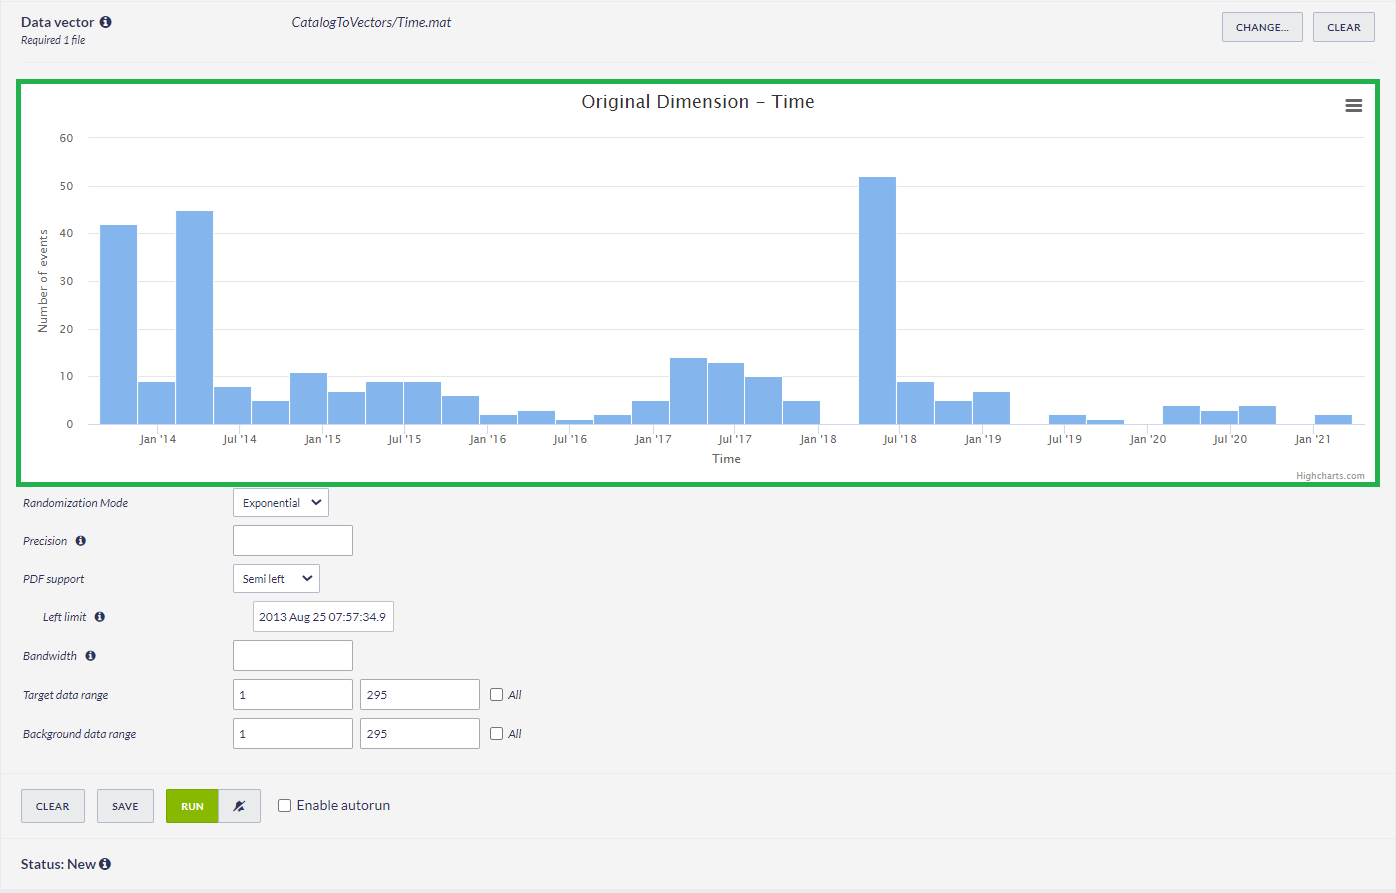
Figure 3. Parameters selection for performing the "Transformation to Equivalent Dimensions" application.
Below the plot of Number of events against data from input vector (green field in Figure 3). The User is therefore requested to fill the fields shown in Figure 3:
- Randomization Mode – Data randomization mode to eliminate identical values in the input parameter vectors. Available options are "None", "Exponential", "Normal" and "Uniform".
- Precision - The User is requested to enter precision of input vector values.
- PDF (Probability density function) support - Available options are "Infinite", "Semi left", "Semi right", "Finite".
- Left limit - The User is requested to enter left hand side limit of x domain.
- Bandwidth - The User is requested to enter bandwidth to be used in the kernel estimator of distribution function.
- Target data range - The User is requested to enter target data range for analysis.
- Background data range - The User is requested to enter background data range for analysis.

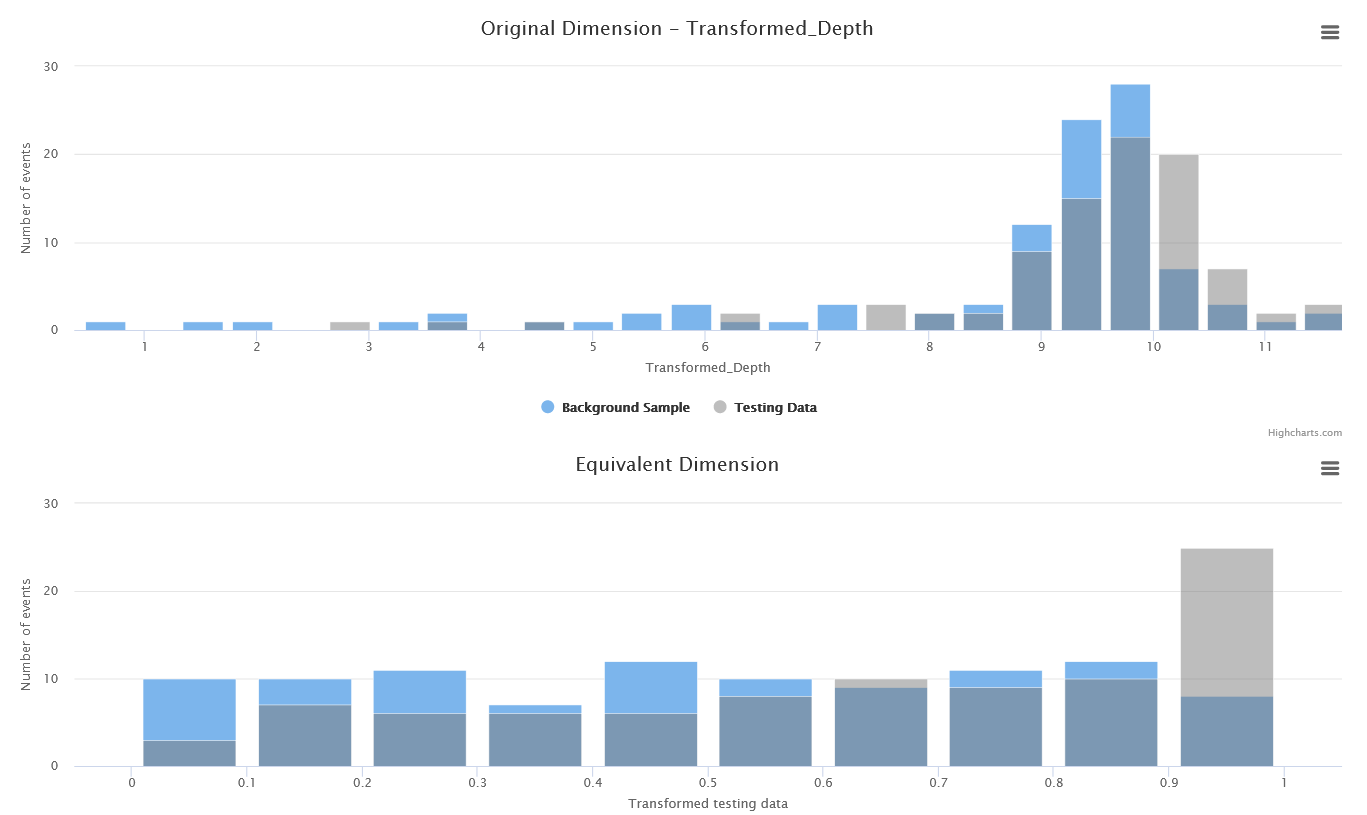
Figure 4. Output figure showing the histogram of original as well as transformed values of input vector.
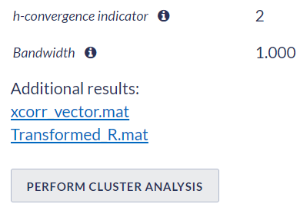
After running of the application is finished successfully the User sees two histograms (Figure 4), two additional result files and a link to perform the "Cluster Analysis" with transformed vector as an input (Figure 5),

Figure 5. A link to result files and to the "Cluster Analysis" application.

